













🧪 Burp Suite: web scanner and crawler for pentest
A pentester arrives at an unfamiliar site and sees only the facade. The real vulnerabilities, SQL injections, XSS, path traversal, hide in the depths: hidden directories, forgotten endpoints, non-obvious request parameters. Manual traversal consumes hours. Automated traversal, without the right tool, either misses critical entry points or crashes the application with an avalanche of requests.
Burp Suite Professional solves this task with a "crawler + scanner" combination. One pass, and you have an application map with each page checked for dozens of vulnerability classes. Everything in one window, without scripts or command line.
This guide is a step-by-step breakdown of the Burp Suite crawler and scanner: from basic traversal to fine-tuning the audit. Screenshots are current for 2024+ versions, the logic hasn't changed since Burp 2.0. We'll cover Crawl, Audit, and the combined Crawl and Audit mode.
💡 Quick overview:
- Launch a basic crawl scan: Dashboard tab, New Scan, Crawl, get a site map in Target.
- Configure the crawler for your task: exclude out-of-scope URLs, add credentials, adjust the request pool.
- Move to auditing: Audit Selected Items on any URL from the map, Burp finds vulnerabilities and organizes them by severity.
- Combine Crawl + Audit for end-to-end testing: the crawler traverses the site, the scanner immediately checks each discovered page.
- Complete the analysis by studying Advisory: payload, request/response, CVSS, and remediation steps.
What is a web crawler in Burp Suite
A web crawler (also known as a spider) is a mechanism that traverses a web application: follows links, submits forms, and logs into protected sections. The result is a tree-like site map on the Target tab, where each URL comes with HTTP methods and request parameters.
Until version 1.7, Burp Suite used Spider, a separate tool with its own tab. Starting with Burp 2.0, PortSwigger replaced it with Crawler, built directly into the Dashboard. All automated actions, traversal, auditing, logging, are collected in one window. Management: pause/resume for each task separately.
Essentially the crawler does the same thing as DirBuster or Dirb: enumerates directories, records hidden URLs. But, unlike them, Burp Crawler analyzes page content, executes JavaScript (if analysis is enabled), and understands the application's navigational logic. DirBuster and Dirb simply brute-force using a dictionary. Crawler builds an application graph.
Running the crawler: basic scanning
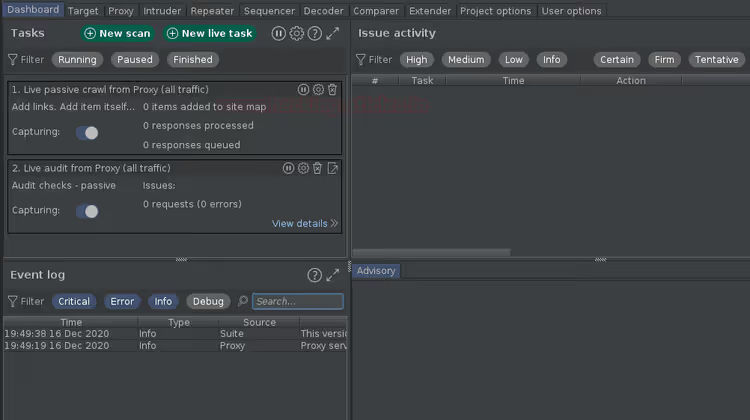
Open Burp Suite and switch to the Dashboard tab. The panel is divided into four zones:
- Tasks, all running traversals and scans. From here you can pause, resume, and view details for each task.
- Event log, Burp Suite events: proxy startup, module failures, scan completion.
- Issue activity, discovered vulnerabilities with filtering by severity and type.
- Advisories, detailed card for the selected vulnerability: payload, request/response, and CVSS.
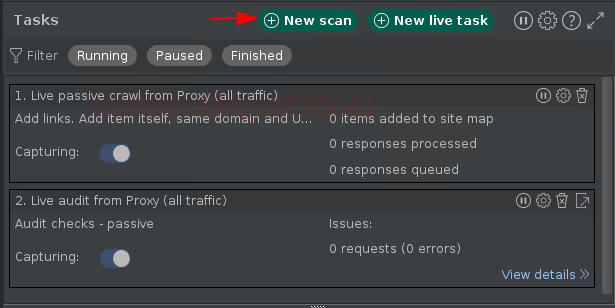
Click the New Scan button at the top of the Tasks section.
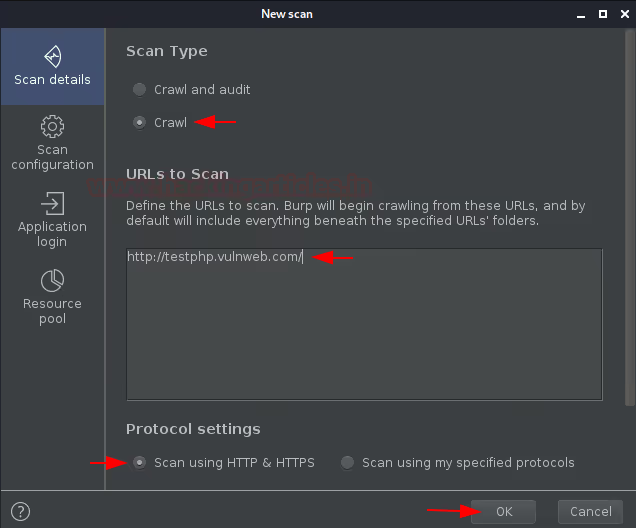
A New Scan popup window will appear with two options:
- Crawl and audit, traversal + audit in one run;
- Crawl, traversal only.
For a first introduction, choose Crawl. Enter a test URL, for example http://testphp.vulnweb.com, and click OK.
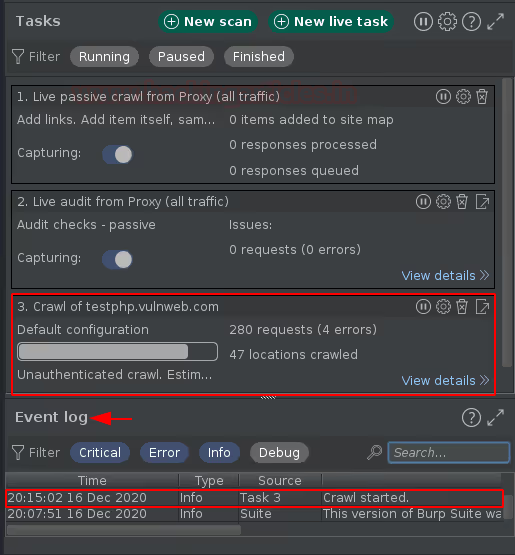
The window will close. On the Dashboard in Tasks, a new task will appear, "Crawl testphp.vulnweb.com". Event log will confirm the "Crawl started" event.
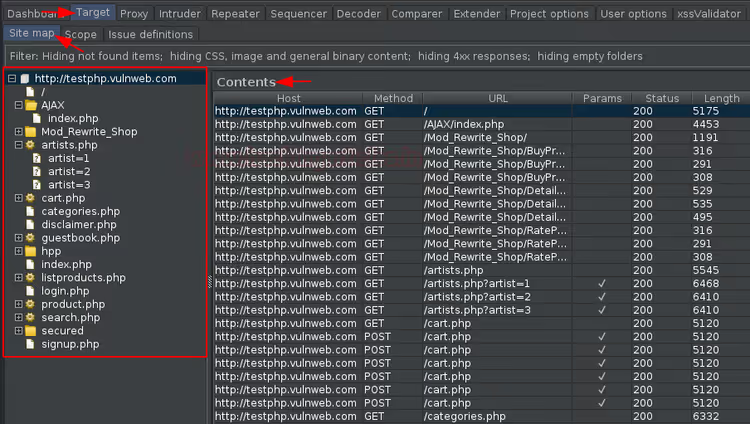
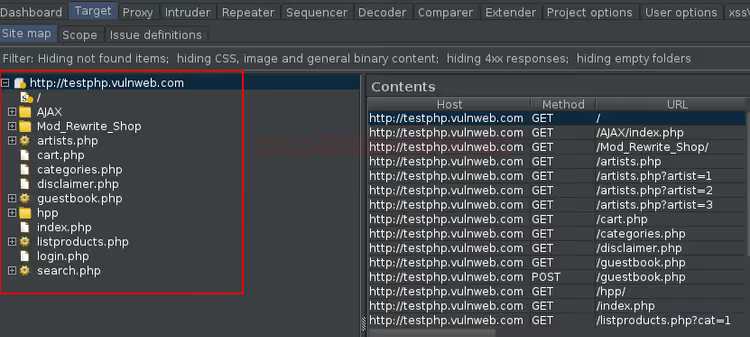
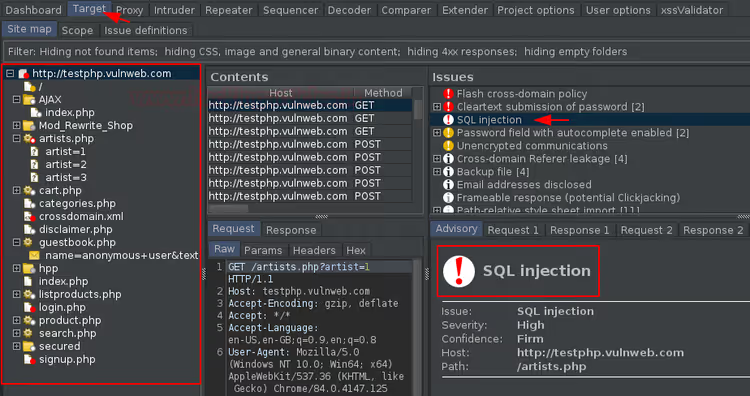
After a couple of minutes, the task will complete. Look for the result on the Target tab, the crawler outputs the site map there in the form of a URL tree.
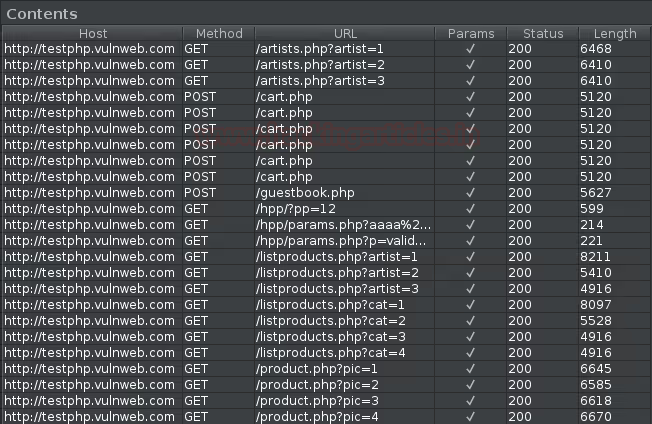
On the right panel, each URL comes with HTTP methods and a Parameters column. Parameters indicate entry points, potentially vulnerable to injections. Double-click the Parameters column header, URLs with parameters will rise to the top.
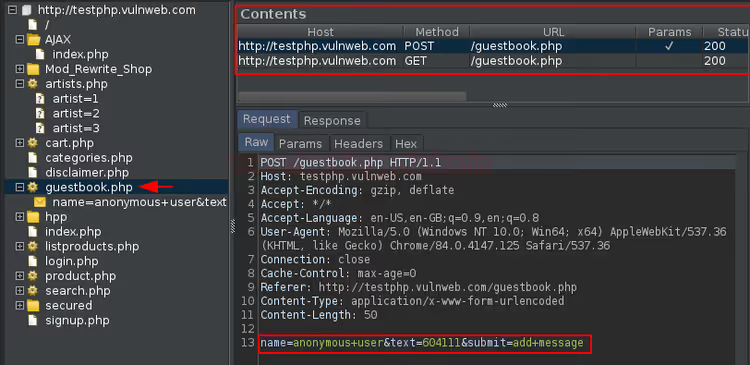
The left panel of Target is occupied by the site tree, clickable and with URL nesting. Select any directory, the right panel immediately shows its methods and parameters.
Fine-tuning the crawler
Basic traversal is sufficient for simple sites. But a real application is more complex: some pages are out of scope, closed sections require authorization, and a fragile application can't withstand dozens of simultaneous requests.
We return to the Dashboard, click New Scan again, but now we don't rush with OK. We configure.
Excluding out-of-scope URLs
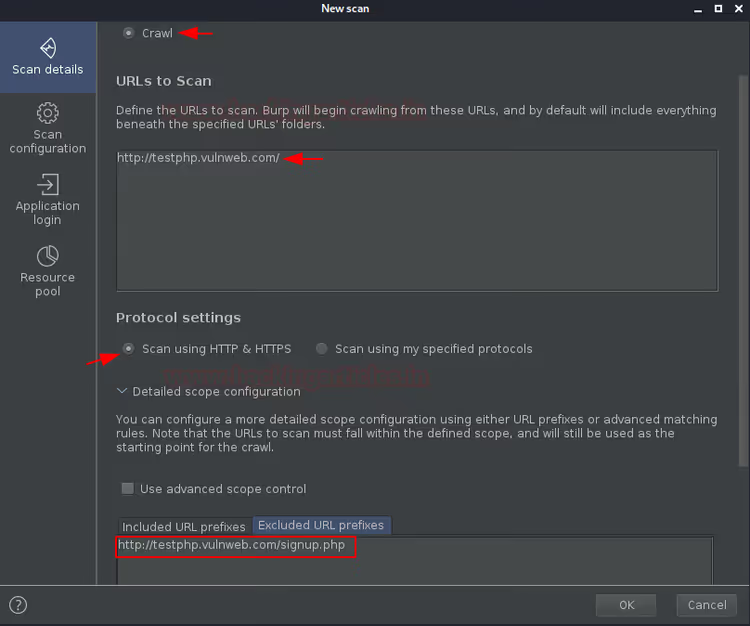
In the Scan details section, find Detailed scope configuration. Go to Excluded URL prefixes and add a URL that should not be included in the traversal, for example http://testphp.vulnweb.com/signup.php.
Creating a custom configuration
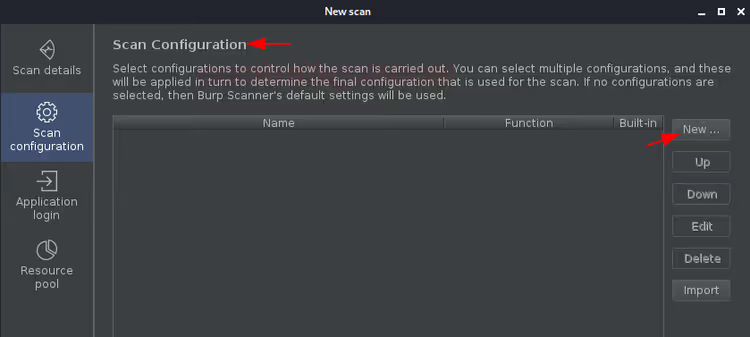
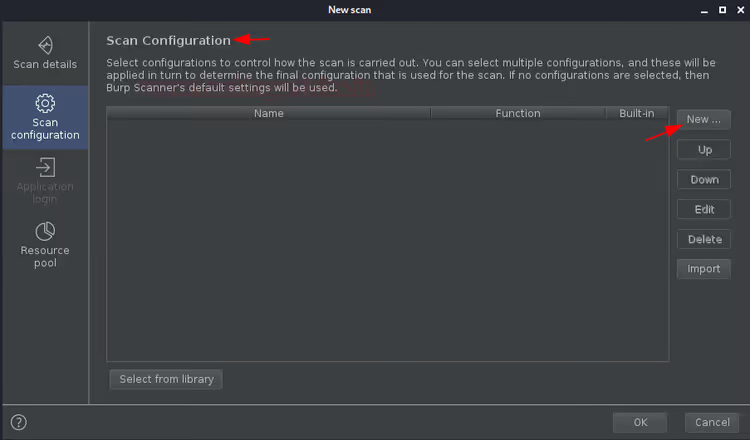
Go to Scan configuration and click the New button.
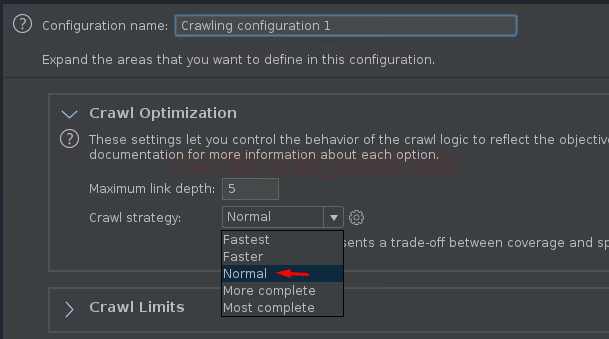
A window with parameters will open. The configuration name can be left as default. The key parameter is Crawl optimization: a slider from "Fastest" to "Deepest" determines how deeply the crawler goes into the application. For a production test, set it closer to Deepest, for quick reconnaissance, closer to Fastest.
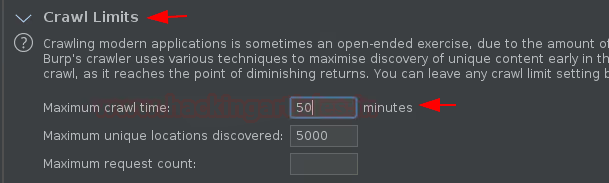
Time and page count limits are set here as well. Reasonable values for a medium-sized application: Maximum crawl time, 50 minutes, Maximum unique locations discovered, 5000.
Credentials for closed sections
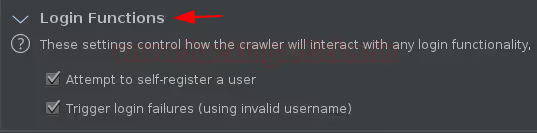
If the application requires login, check the Log in to user registration portals and Log in using invalid credentials checkboxes. The crawler will attempt to register with random data or enter knowingly incorrect credentials to see the site's behavior during failed authentication.
Click Save, the configuration appears in the Scan configuration dropdown list.
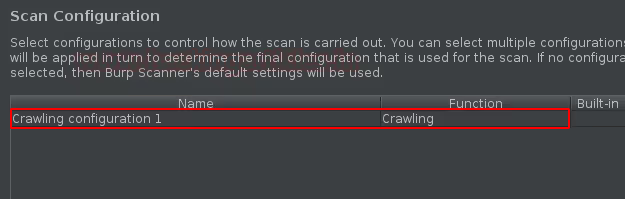
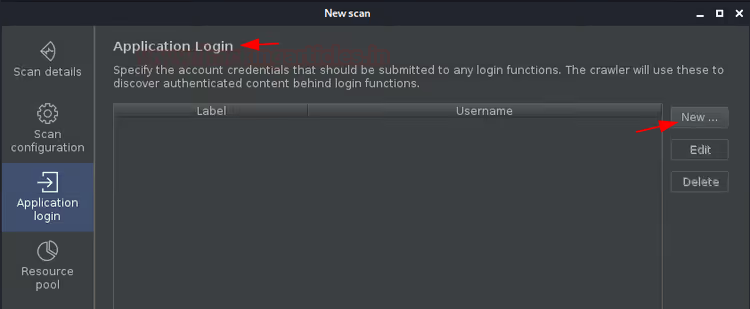
Now let's add real credentials, they'll be useful if the crawler encounters an admin portal or closed section. Go to the Application login section and click Create.
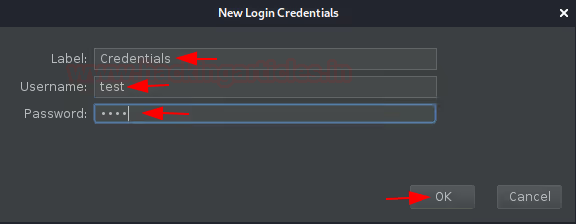
Enter the login and password, click OK.
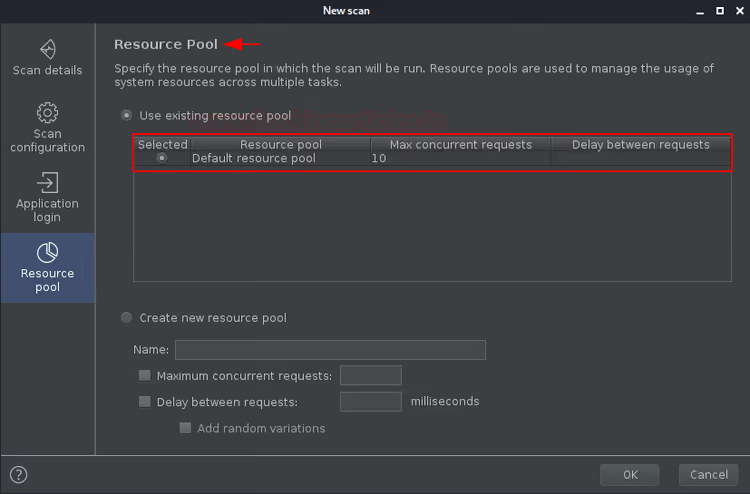
Resource pool and concurrent requests
The Resource pool section manages how many concurrent requests the crawler sends to the application and with what delay. For a fragile application, reduce the number of threads and increase the delay. For a demo stand, we leave the default values.
Click OK, the crawler starts with the specified configuration. We track progress on the Dashboard.
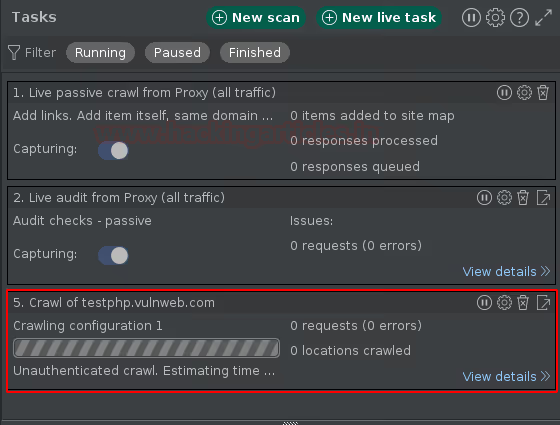
After completion, we go to the Target tab. The signup.php page is absent in the site map, the excluded prefix worked as intended.
Vulnerability scanning: audit mode
The crawler provides an application map. Audit goes further, it checks discovered URLs for vulnerabilities: SQL injections, XSS, command injection, path traversal, and dozens of other classes. In Burp Suite terminology, this is called "active scanning".
Unlike passive scanning (analyzing responses without additional requests), active auditing sends modified requests with payloads and interprets the application's response.
Audit with default settings
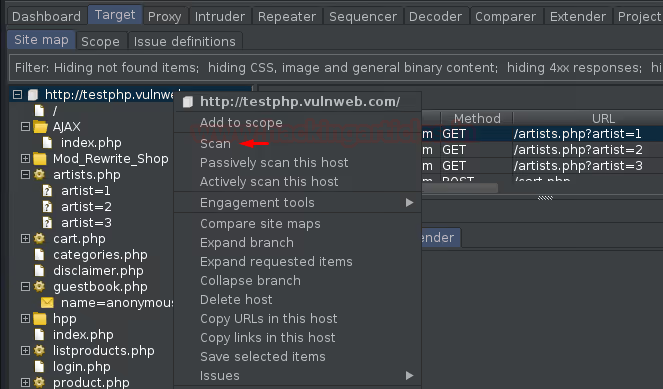
If the application has already been scanned by the crawler, you can audit any URL from the site map. On the Target tab, right-click the base URL and select Scan.
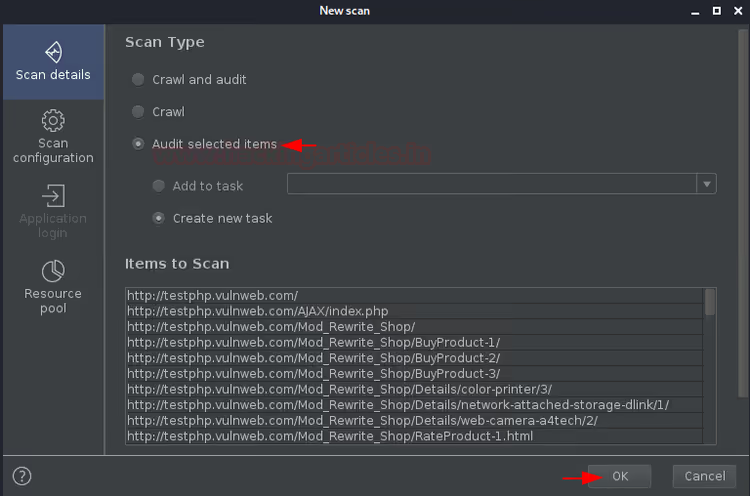
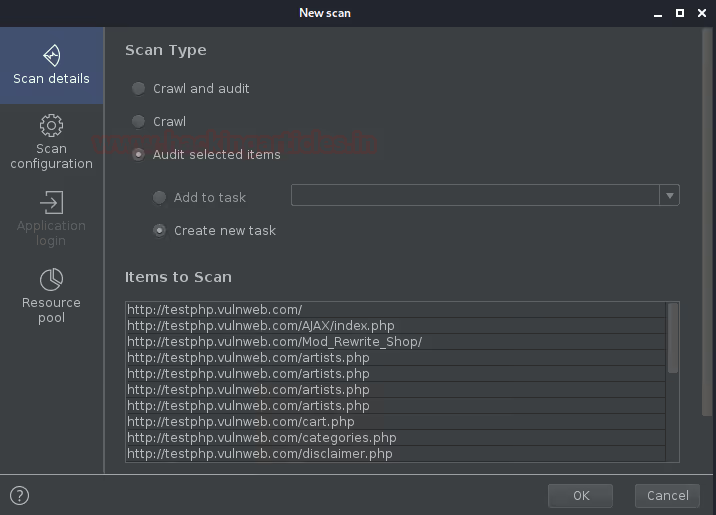
The New Scan window opens again, but now the Audit selected items option is active. All URLs from the site map are pulled into the Items to scan field automatically. Click OK.
We go to the Dashboard. The picture has changed: Tasks and Event log sections are active, and most importantly, Issue activity and Advisories now have data.
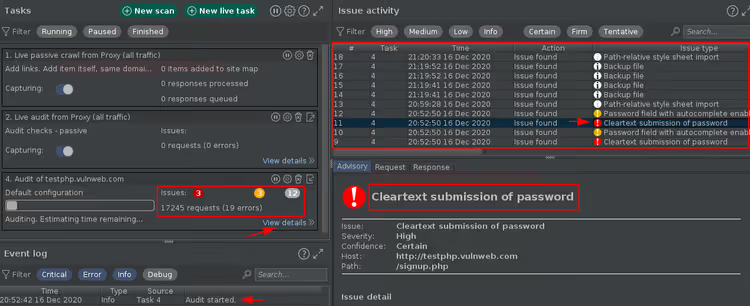
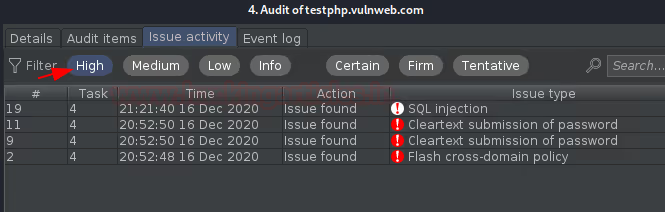
In a few minutes, the scanner sent about 17,000 requests and identified vulnerabilities grouped by severity: high (red), medium (yellow), info (gray).
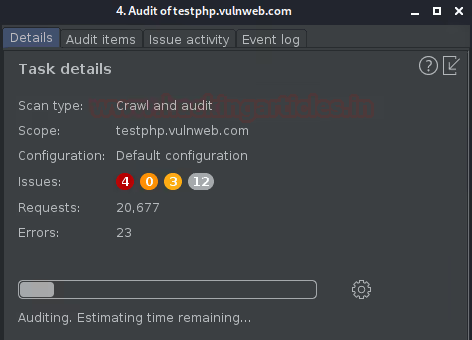
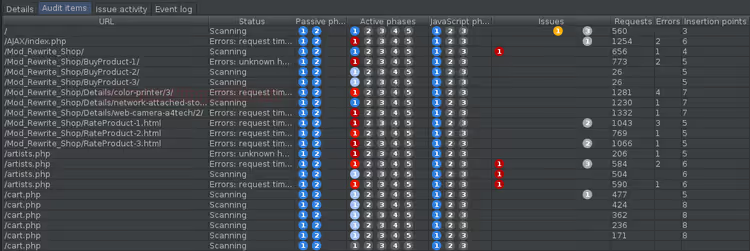
A window with a full breakdown will open. The Audit items tab shows checked URLs and the number of discovered vulnerabilities.
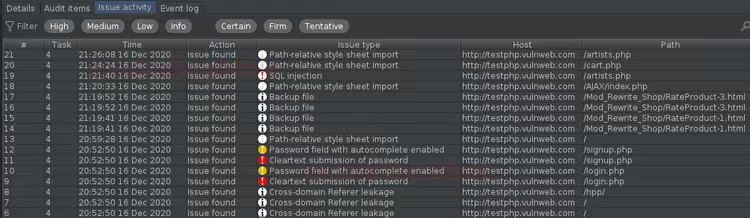
The Issue activity tab shows the same information broken down by severity. Each vulnerability can be expanded to view the Advisory.
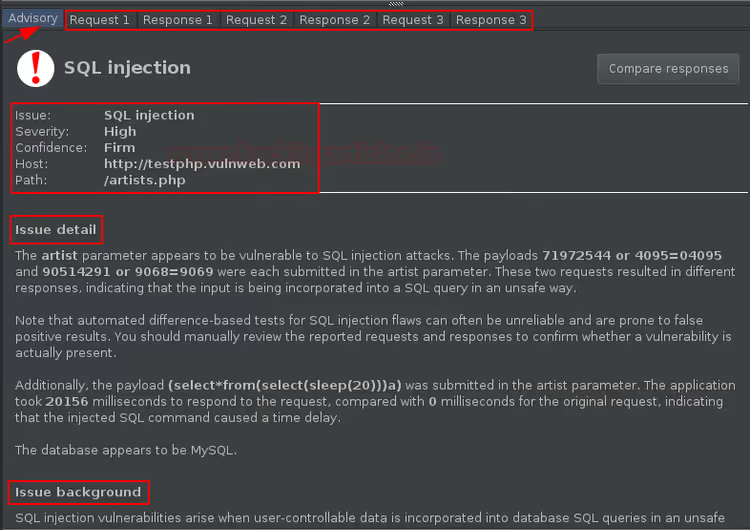
The Advisories tab shows the full card for the selected vulnerability. At the top are the URL, severity, confidence, CVSS score. Below are the description, remediation recommendations, and links to external resources on this vulnerability class.
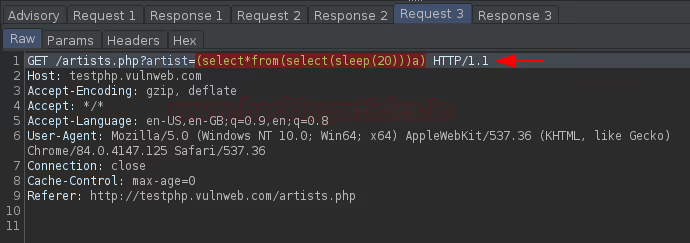
To see the specific HTTP request and response that triggered the finding, go to the HTTP request/response tab. This is where you see the payload Burp sent to the application and the server response confirming the vulnerability.
Fine-tuning the audit
The default audit covers all vulnerability classes. But sometimes you need to narrow the focus: check only SQL injections or only XSS. Or, conversely, add custom checks for a specific API.
Creating an audit profile
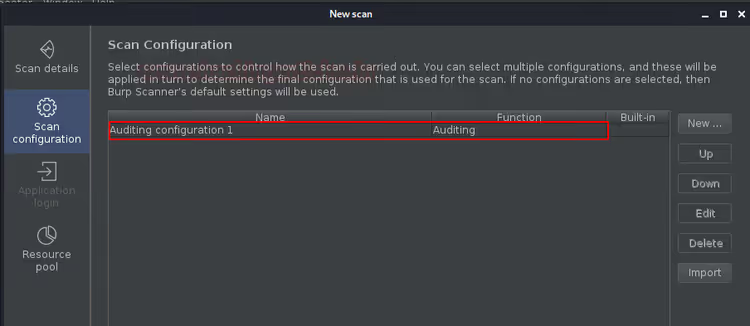
We open the New Scan window again. In the Scan configuration section, click New, create an audit configuration.
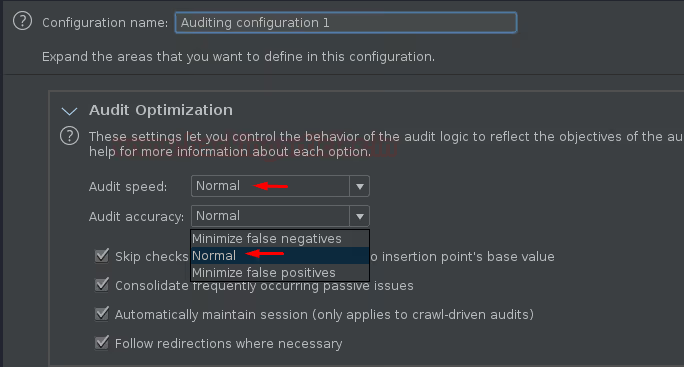
In the window that opens, go to the Audit optimization tab. Here are three levels:
- Default, standard coverage, balance of speed and depth;
- Thorough, extended set of payloads and deeper checking of each parameter;
- Fast, lightweight mode, fewer requests and checks.
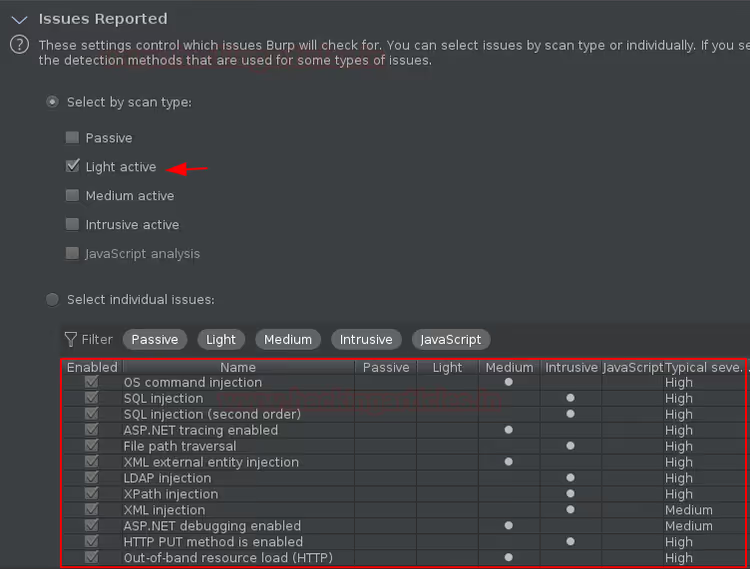
The Issues reported section allows you to select specific vulnerability classes. For example, leave only SQL injection and Cross-site scripting, then the scanner won't waste time checking path traversal or command injection.
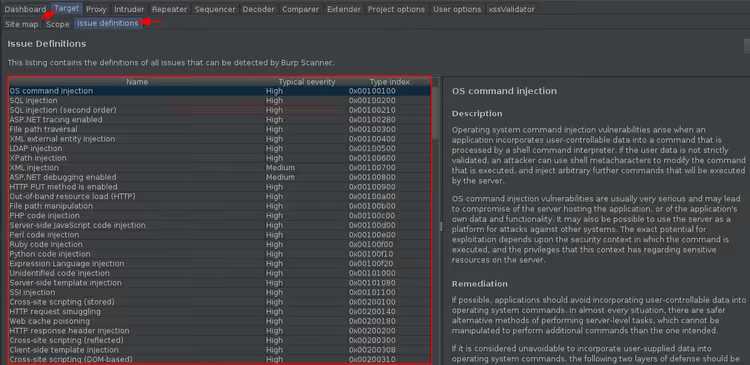
On the Audit optimization > Custom tab, you can more precisely configure the intersection of classes and the intensity of checks.
Scan types
On the Audit optimization tab, there is a Scan type section with four levels of aggressiveness:
- Passive, only traffic analysis, no additional requests. Safe for production, but only finds headers and configuration issues.
- Light active, minimal set of active checks. Compromise between coverage and risk.
- Medium active, more checks, medium load. For staging.
- Intrusive, full set, including destructive checks. Only on isolated stands.
In the same place, JavaScript** analysis** can be optionally enabled, the crawler executes JS to discover dynamic content and hidden endpoints in SPA applications.
The final choice of scan type is displayed at the top of the configuration window.
Insertion points
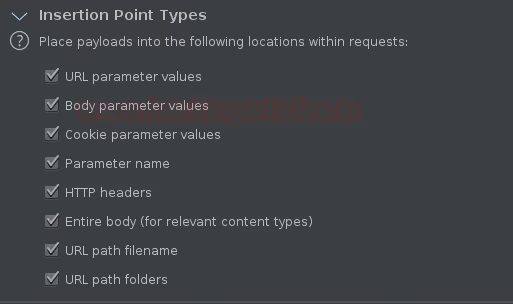
Insertion points are positions within requests where Burp inserts payloads. By default, the scanner determines them automatically: URL parameters, POST body, headers, cookies. In advanced mode, you can limit or expand the set of positions.
We save the configuration, it appears in the dropdown list.
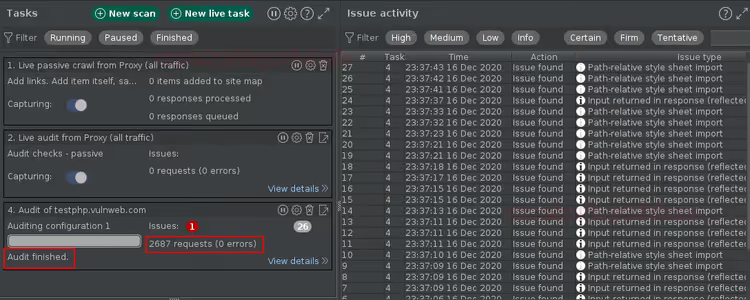
Click OK. The scanner sends about 2,700 requests (versus 17,000 on a full audit) and finds one high-severity vulnerability.
Now when you right-click on a URL in Target, not one but two scanning options appear: default and our custom one.
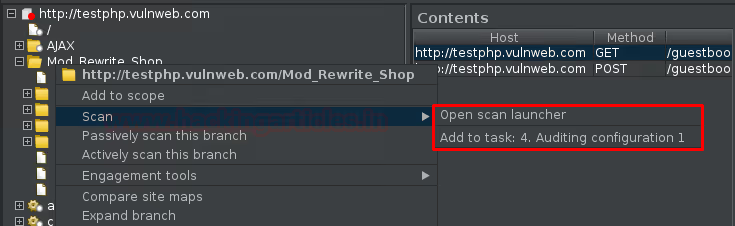
Built-in checks from the library
Manual audit configuration is not required. Burp Suite comes with a library of ready-made profiles. When creating a new configuration, click Select from library at the bottom of the window.
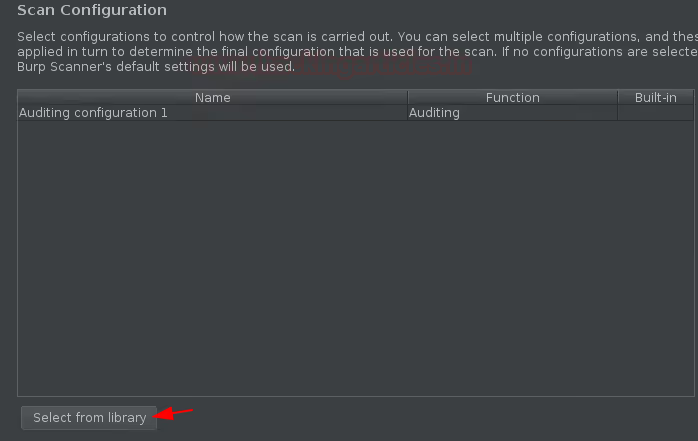
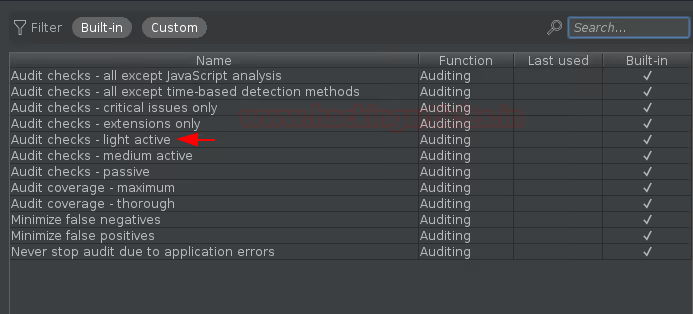
Select any built-in profile, for example, one tailored to a specific vulnerability class or application type.
The selected profile is pulled back into the New Scan window.
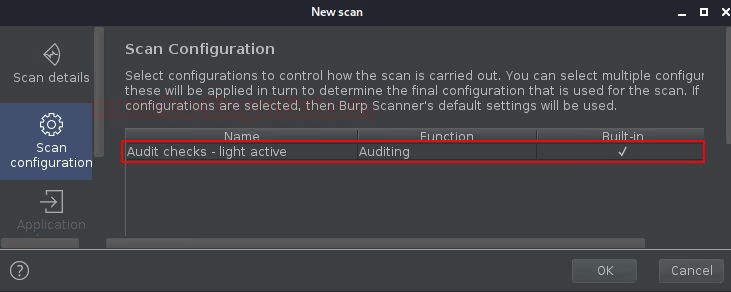
Click OK. After the audit completes, the URL context menu in Target shows three scanning options: default, custom, and library.
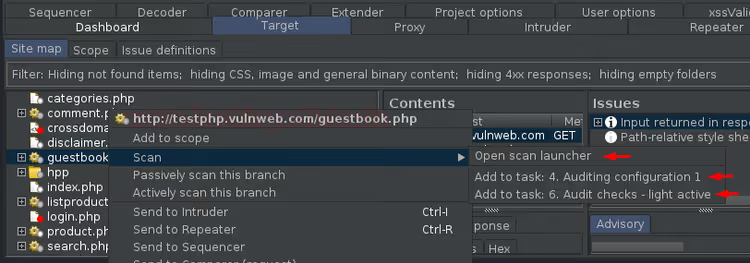
Scan + audit in one run
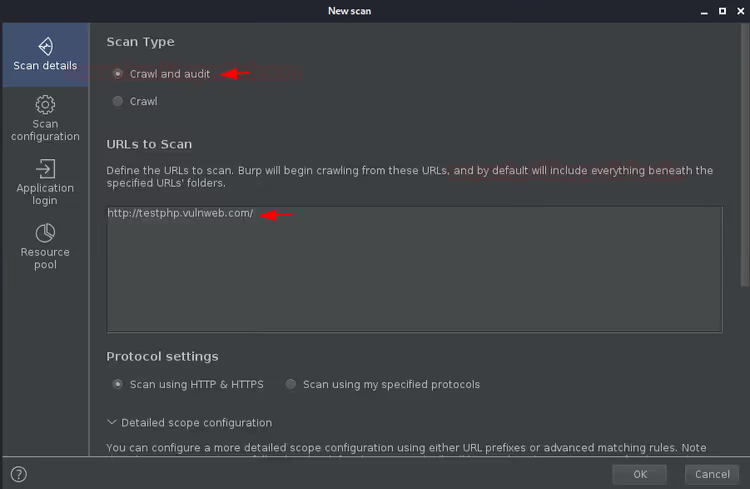
So far we've been running the crawler and audit separately. But Burp Suite supports end-to-end Crawl and Audit mode: first it traverses the application, then immediately checks everything found for vulnerabilities.
On the Dashboard, click New Scan again, select Crawl and audit, enter the URL.
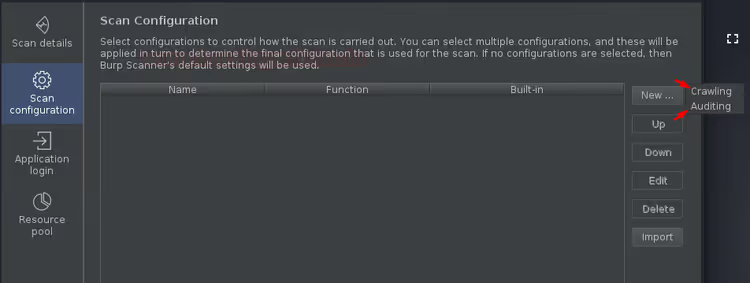
In the configuration section, when clicking Create, Burp asks which part to configure: crawler optimization or audit parameters. The internal parameters are the same as we saw separately.
This is the main mode for production pentesting: one run covers both reconnaissance and vulnerability discovery. For large applications with tens of thousands of pages, it's faster to split into two stages, first the crawler, then the audit. But for most sites, Crawl and Audit delivers results in one pass.
Task management: deletion and cleanup
Completed and outdated tasks should be deleted to avoid cluttering the Dashboard. Click the trash icon next to the task.
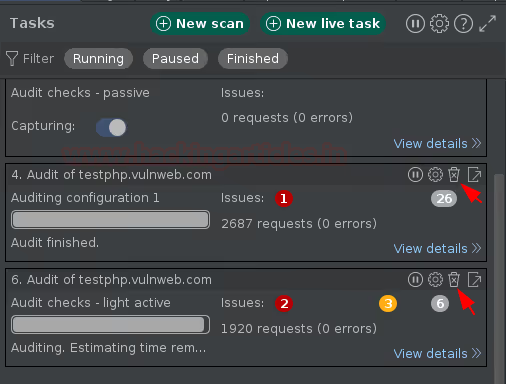
Confirm deletion in the popup window.
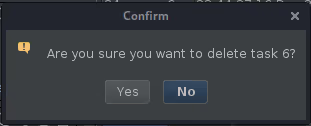
Tasks are deleted instantly, along with all collected data. Before deleting, make sure audit results are saved or exported.
Video: complete Burp Suite Scanner breakdown
The crawler and scanner are just part of Burp Suite. This video covers the complete pentest cycle: from proxy configuration to active auditing and exploiting discovered vulnerabilities.
⁉️🤔 Frequently asked questions
How does Burp Suite crawler differ from DirBuster and Dirb?
DirBuster and Dirb work from a dictionary, enumerating directory names from a ready-made list. Burp Suite Crawler builds an application graph: analyzes page content, extracts links, submits forms, and can log in. The result is an application map with navigational relationships, methods, and parameters. It finds what dictionaries don't have: dynamic URLs, entry points through JavaScript redirects, and hidden endpoints behind login forms.
What version of Burp Suite is needed for the crawler and audit?
The crawler and active audit are only available in Burp Suite Professional ($499 per user per year for 2026, Burp Suite Professional pricing). Community Edition includes proxy, Repeater, Intruder with rate limiting, and Decoder, but not Crawler and not Scanner. Professional gives both tools plus unlimited Intruder, Collaborator, and BCheck scripts for custom checks. Starting with version 2025, Professional also includes Burp AI, an AI assistant for interpreting scan results. Enterprise Edition adds CI/CD integration, scheduler, and team collaboration.
Can you scan a site not visible from the internet?
The crawler and audit work through Burp Suite's upstream proxy. Everything accessible to the browser through Burp Proxy is accessible to the crawler: localhost, staging servers behind VPN, corporate portals. No additional network configuration is required, scope is set through Target scope.
How to avoid crashing production with active auditing?
Choose Light active instead of Intrusive. Disable checks with data corruption risk: SQL injection with INSERT/UPDATE/DELETE, destructive command injection, file upload. Three rules: (1) Passive-only for the first pass, (2) Light active without intrusive checks for the second, (3) Intrusive only on staging. Resource pool: 1 thread, 500 ms delay.
What's the difference between passive audit and active audit?
Passive auditing (Passive scanning) doesn't send new requests, it analyzes traffic that has already passed through the proxy: headers, cookies, response bodies. Active auditing (Active scanning) generates new requests with modified payloads. Passive won't find SQL injection, but will identify missing security headers and cookies without
HttpOnly/Secure. In practice, both are used sequentially: passive while surfing, active targeting interesting endpoints.
How relevant is Burp Suite in 2026?
Burp Suite remains the de facto standard for web pentesting. In 2025, PortSwigger added an AI assistant for vulnerability analysis, in 2026, a combined Professional/Community installer, Markdown notes, and extended HTTP traffic control. Competitors (OWASP ZAP, Caido) are advancing, but in terms of active audit depth and extension ecosystem, Burp is still out of reach.
Which Burp Suite mode to choose for your task
Crawler, audit, or both at once, the choice depends on the pentest stage and objective.
If you need to build an application map before manual analysis, run Crawl with Deepest optimization. Add credentials for closed sections and exclude out-of-scope URLs (logout pages, password reset).
If the map already exists and the goal is to find vulnerabilities, use Audit on a specific set of URLs. For the first pass, Passive + Light active. Leave Intrusive for staging.
For comprehensive "from scratch" testing, Crawl and Audit. One run, minimal manual operations.
And the main rule: never run Intrusive on someone else's production without written consent. Even Light active leaves traces in server logs.

A professional team of writers and editors specializing in creating quality content.