













 AIIllustrative image: AI-generated
🧠 Monitoring EC2 memory and disk with CloudWatch Agent: step by step setup
Your EC2 instance stopped responding, yet CloudWatch shows everything is fine? Classic. AWS provides CPU, network, and disk I/O metrics out of the box, but it does not show memory usage or free disk space. Those numbers are hidden inside the virtual machine, and until you pull them out, you are flying blind.
When memory runs out, the instance does not warn you; it simply crashes. The OOM Killer terminates processes in random order, and you are left guessing: did a plugin fail? Did the database go down? The actual cause is that you ran out of gigabytes of RAM you were not monitoring. Disk tells the same story: logs, backups, and temp files fill up storage silently, and one morning you see No space left on device.
The solution is CloudWatch Agent, the standard AWS agent that collects memory, disk, swap, and about two dozen other system metrics and sends them to CloudWatch. Setup takes 20 minutes and fits within the free tier (10 custom metrics per month). Below is a step-by-step guide from IAM to a finished dashboard.
💡 Quick overview:
- Create an IAM policy with
cloudwatch:PutMetricDataand attach it to a user - Download and install CloudWatch Agent on an Ubuntu instance
- Configure the JSON file: memory, disk, swap
- Start the agent and verify that metrics are flowing to CloudWatch
- Build a custom dashboard with memory and disk usage graphs
AWS identity and access management
The agent needs permissions to send metrics to CloudWatch. We will create an IAM policy and attach it to a user with programmatic access.
IAM policy
Open the IAM console, go to Policies → Create policy, and switch to the JSON tab. Paste this document:
1 { 2 "Version": "2012-10-17", 3 "Statement": [ 4 { 5 "Sid": "CloudWatchAgentMetrics", 6 "Effect": "Allow", 7 "Action": [ 8 "cloudwatch:PutMetricData", 9 "ec2:DescribeTags", 10 "cloudwatch:GetMetricStatistics", 11 "cloudwatch:ListMetrics" 12 ], 13 "Resource": "*" 14 } 15 ] 16 }
Click Review policy, enter a name (for example, CloudWatchAgentPolicy), and click Create policy.
IAM user
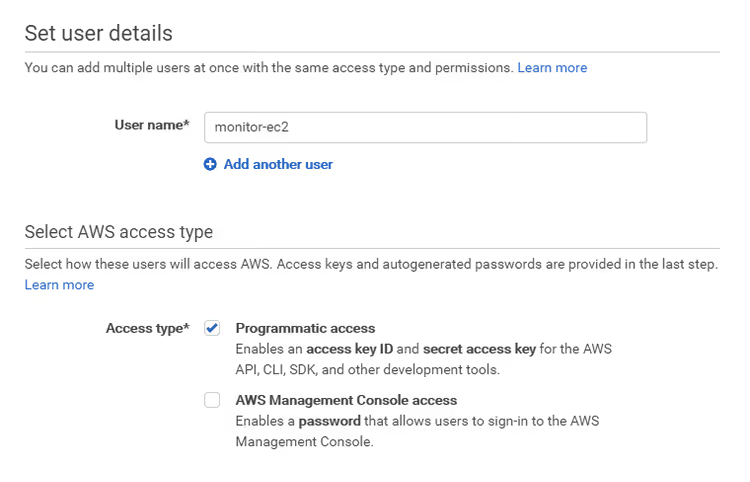
Go to Users → Add user. Enter a name and make sure to check the "Programmatic access" checkbox; this provides the Access Key ID and Secret Access Key the agent will use for authentication.
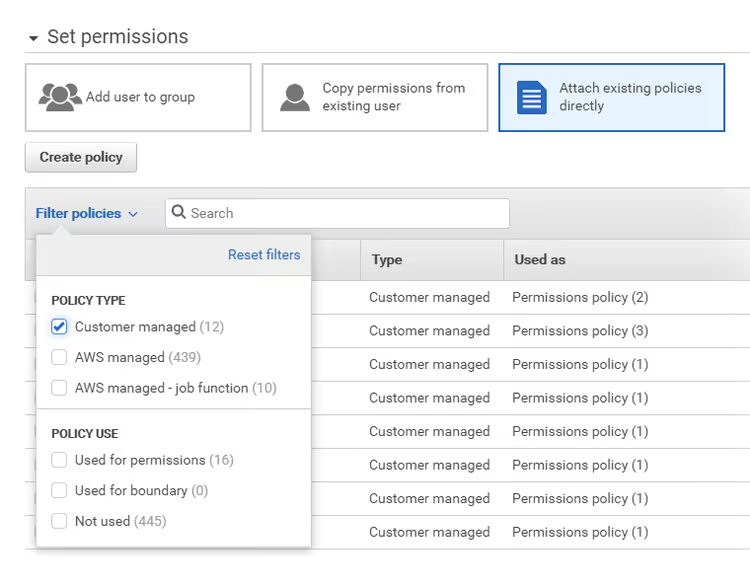
On the permissions screen, select Attach existing policies directly. In the policy type filter, choose Customer managed to quickly find the CloudWatchAgentPolicy you just created.
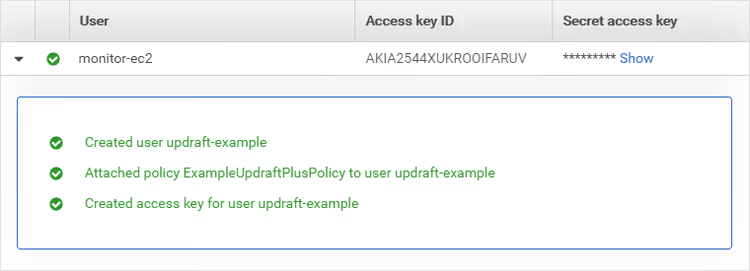
Check the policy and click Next → Create user. AWS will display the access keys. Save the Access Key ID and Secret Access Key right now. If you close the page, the keys disappear forever, and you will have to recreate them.
Installing CloudWatch Agent
The old Perl monitoring scripts (CloudWatchMonitoringScripts-1.2.2.zip) have long been marked as deprecated. The current approach is the unified CloudWatch Agent, which collects not only memory and disk but also swap, CPU load, network interfaces, and about two dozen other metrics out of the box.
Download and installation
Connect to the instance via SSH and download the agent package for Ubuntu:
1 wget https://amazoncloudwatch-agent.s3.amazonaws.com/ubuntu/amd64/latest/amazon-cloudwatch-agent.deb
Install the package with dpkg:
1 sudo dpkg -i amazon-cloudwatch-agent.deb
If the package manager complains about missing dependencies, install them with a single command:
1 sudo apt-get install -f
The agent is installed but does not yet know which metrics to collect or which keys to use for CloudWatch authentication. Let us configure it.
Note: the agent is also available through AWS Systems Manager (SSM). If you have dozens of instances, deploying it centrally via Run Command without SSH to each machine is more convenient. For one or two instances, manual installation is simpler and faster.
Configuring the agent
Creating the configuration file
The CloudWatch Agent configuration is a JSON document that describes which metrics to collect and at what interval. Run the built-in wizard:
1 sudo /opt/aws/amazon-cloudwatch-agent/bin/amazon-cloudwatch-agent-config-wizard
The wizard will ask several questions interactively: which server type (EC2/on-premises), where to send metrics (CloudWatch), and which metrics to collect. To track memory and disk, answer as follows:
- Operating system: Linux
- Are you using Amazon EC2?: Yes
- Which metrics to collect: Custom metrics (
memanddisk_used_percent) - Resolution: 60 seconds (Standard)
- Log files: skip if you do not need logs
The wizard will generate a config.json file in the /opt/aws/amazon-cloudwatch-agent/bin/ directory. Here is a minimal working example for memory used percent + disk used percent + swap:
1 { 2 "agent": { 3 "metrics_collection_interval": 60, 4 "run_as_user": "root" 5 }, 6 "metrics": { 7 "metrics_collected": { 8 "mem": { 9 "measurement": [ 10 "mem_used_percent" 11 ] 12 }, 13 "disk": { 14 "measurement": [ 15 "disk_used_percent" 16 ], 17 "resources": [ 18 "/" 19 ] 20 }, 21 "swap": { 22 "measurement": [ 23 "swap_used_percent" 24 ] 25 } 26 } 27 } 28 }
The resources parameter for disk specifies the mount point: "/" is the root EBS NVMe SSD volume, the instance's primary storage. If you have additional volumes (for example, /data), add them to the array.
Agent credentials
The access keys saved during the IAM step need to be provided to the agent. Create a credentials file in the user's home directory:
1 sudo nano /opt/aws/amazon-cloudwatch-agent/etc/amazon-cloudwatch-agent.toml
Add this section:
1 [credentials] 2 shared_credential_profile = "AmazonCloudWatchAgent"
Then add the credentials to the standard AWS credentials file:
1 aws configure --profile AmazonCloudWatchAgent
The system will prompt for the Access Key ID, Secret Access Key, and region. After you fill them in, the agent will be able to send metrics on behalf of the IAM user you created.
An alternative approach is an IAM role attached to the instance. This is more secure (no keys stored on disk) and simpler when scaling. If you launch EC2 with an IAM role that has cloudwatch:PutMetricData, the agent will pick up the permissions automatically, and you can skip the credentials step.
Testing
Start the agent manually and verify that metrics are being sent:
1 sudo /opt/aws/amazon-cloudwatch-agent/bin/amazon-cloudwatch-agent-ctl \ 2 -a fetch-config \ 3 -m ec2 \ 4 -c file:/opt/aws/amazon-cloudwatch-agent/bin/config.json \ 5 -s
The -s flag starts the agent as a service. Within a minute or two, the first metrics will appear in CloudWatch. To confirm data is flowing, open the CloudWatch console, go to Metrics → All metrics, and find the CWAgent namespace (the agent writes there by default).
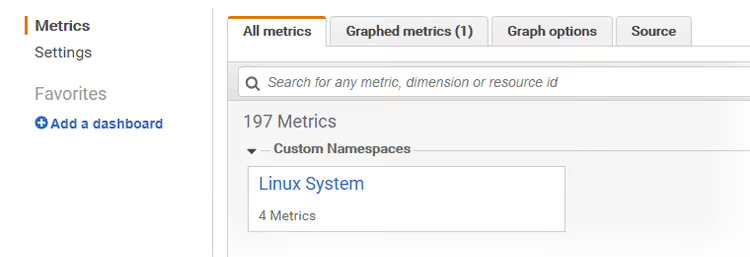
Expand the namespace, and you will see InstanceId dimensions broken down by metrics: mem_used_percent, disk_used_percent, and swap_used_percent. Click any row to generate a graph; you can immediately verify that data is arriving and looks sensible.
Four basic metrics (memory, disk, swap, CPU) on two instances equals 8 metrics. The CloudWatch free tier includes 10 custom metrics per month, as described on the pricing page. You fit within that limit. If you have more than three instances, some metrics will exceed the limit, but the cost is modest: $0.30 per metric per month (AWS data as of 2026).
Setting up the schedule
By default, the agent runs as a systemd service and sends metrics at the interval specified in metrics_collection_interval (60 seconds in our config). No additional cron entries are required; systemd ensures the agent stays alive and restarts if it crashes.
Check the status:
1 sudo systemctl status amazon-cloudwatch-agent
Verify that the service is active (running) and enabled for startup (enabled). If not, start and enable it:
1 sudo systemctl enable amazon-cloudwatch-agent 2 sudo systemctl start amazon-cloudwatch-agent
After a reboot, the agent will start automatically.
For a visual demonstration of the entire process, from IAM to dashboard, see this video:
Building a custom dashboard
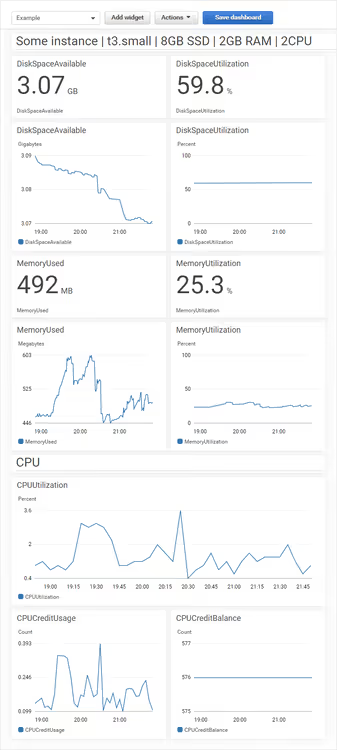
Metrics are arriving; now you need to package them nicely. I will show you how to build a dashboard for monitoring a production instance: memory, disk, CPU load, and credit balance (for T-series) on one screen.
Creating the dashboard
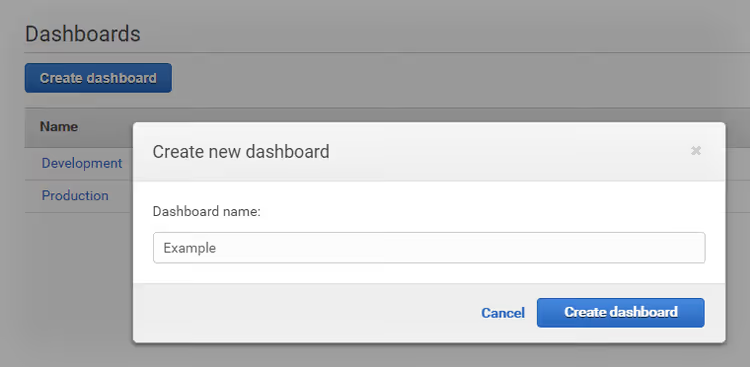
In the CloudWatch console, go to Dashboards → Create dashboard. Enter a name (for example, Production-EC2) and choose a widget type.
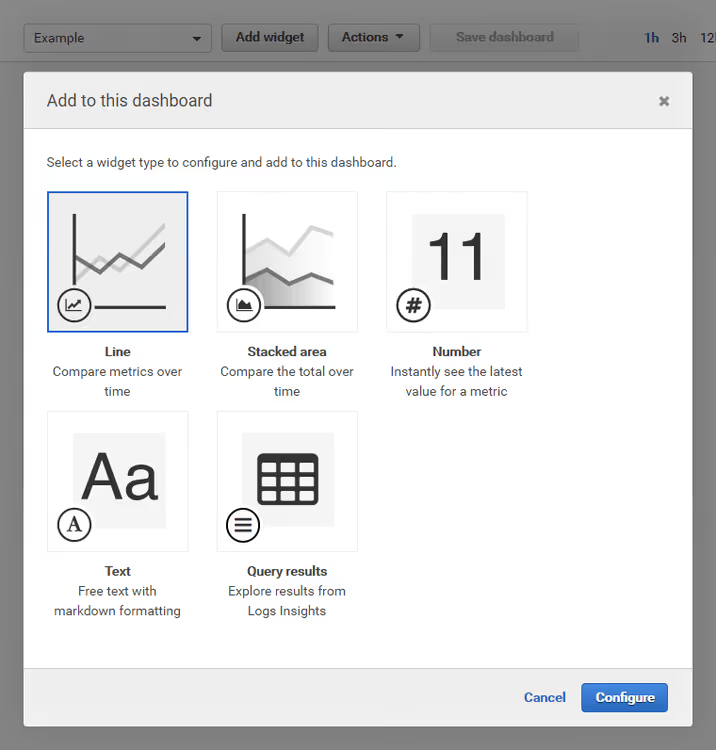
Select Line for the first graph; this type is best suited for displaying metrics over time.
Graph widget
Click Add widget and select the Line type, a simple line graph and the best choice for most metrics. In the dialog that opens, click Configure and navigate to the CWAgent namespace.
Find the mem_used_percent metric for your instance (by InstanceId) and click the row; CloudWatch will immediately display a graph.
Tip: the Stacked area type works well when a single widget has multiple metrics (for example, memory + swap); Number is useful for instantly reading the current value (handy in a corner of the dashboard); Text is for headings and notes between graphs.
Fine-tuning the graph
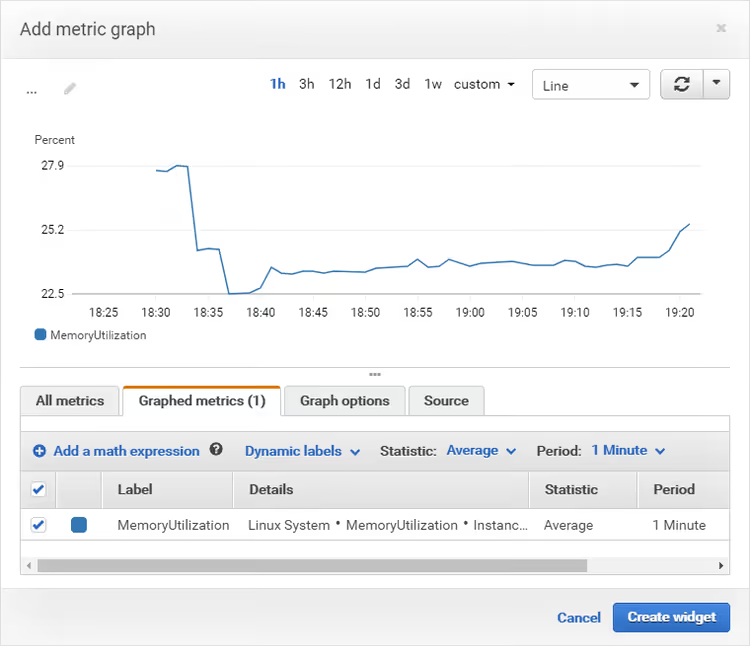
A few settings that make the graph readable:
Period: if the agent sends metrics once a minute, choose a 1-minute period to see the full resolution of the data.
Title: rename the graph legend to something human-friendly, "RAM used%" rather than
mem_used_percent / i-1234567890abcdef0.Y-axis maximum (Graph options): fix the limit (for example, 100 for percentages or 16 for 16 GB of RAM). Without this, CloudWatch autoscales the axis, and a small spike looks just as alarming as a critical situation. With a fixed limit, you can tell at a glance how close you are to the edge.
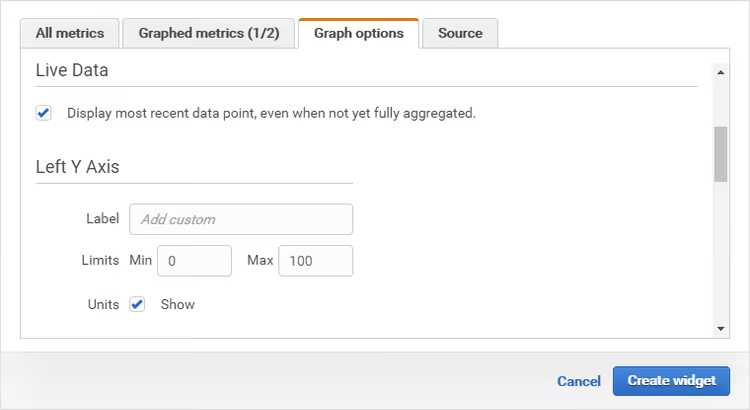
Click Create widget; the first dashboard block is ready. Repeat for each metric: disk_used_percent, then swap_used_percent, then cpu_usage (a built-in EC2 metric, not from CWAgent), and CPUCreditBalance for T-series. You can drag, resize, and edit widgets. When everything looks right, click Save dashboard.
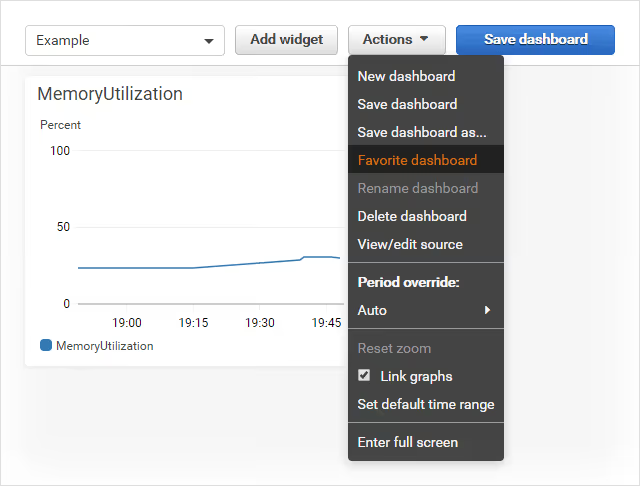
The dashboard is ready. Add it to favorites (the star in the top menu), and return with one click whenever you need to check the instance state before a deploy or after a traffic spike.
⁉️🤔 Frequently asked questions
Why do standard EC2 metrics not include memory and disk?
AWS virtualizes CPU and network at the hypervisor level; these metrics are available externally without entering the guest OS. Memory and disk are internal resources of the virtual machine; the hypervisor does not know about them. To see them, you need an agent inside the OS that reads
/proc/meminfoanddfand sends the data to CloudWatch. That is exactly what CloudWatch Agent does: once a minute it queries system counters and sends them to theCWAgentnamespace. The full list of about two dozen metrics is in the official AWS documentation.
How much does this cost?
For a typical scenario of 1-2 instances with 4 metrics each, nothing. The CloudWatch free tier includes 10 custom metrics, 10 alarms, and 3 dashboards per account per month, according to the CloudWatch pricing page. Two instances at 4 metrics each equals 8 of the 10 free metrics. If you have more than three instances, exceeding the limit costs $0.30 per metric per month. For a dozen servers, that is $6-9 per month, the price for avoiding surprises at three in the morning.
Why is CloudWatch Agent better than the old Perl scripts?
The Perl scripts (
mon-put-instance-data.pl) have been officially deprecated since 2023 and receive no updates. CloudWatch Agent is the officially supported tool that writes not only to CloudWatch but also to Amazon Managed Prometheus; it collects metrics via StatsD and collectd; it can send logs and traces. Most importantly, it integrates with Systems Manager, meaning you can deploy it to 50 instances with a single command from the console, without SSH. If you still have Perl scripts running, migrate: the oldawscreds.confformat with keys in plain text on disk is a security hole. CloudWatch Agent works with IAM roles and does not require storing secrets in a text file.
What should I do if metrics do not appear in CloudWatch?
Check in order: (1) service status via
systemctl status amazon-cloudwatch-agent, which should beactive; (2) agent logs in/opt/aws/amazon-cloudwatch-agent/logs/amazon-cloudwatch-agent.log, where you will find the specific error; (3) IAM permissions, the user or role must havecloudwatch:PutMetricDatapermission; (4) region, the agent and the console must point to the same AWS region. In my experience, the overwhelming majority of issues are either permissions or region mismatch.
Can I monitor Windows instances?
Yes, CloudWatch Agent supports Windows Server on par with Linux. Installation is via an MSI installer from the same S3 bucket (
amazon-cloudwatch-agent.s3.amazonaws.com/windows/amd64/latest/). Configuration uses the same JSON, but metric names differ: instead ofmem_used_percent, useMemory % Committed Bytes In Use. The configuration wizard on Windows will automatically substitute the correct names.
What memory and disk monitoring provides in practice
You launched CloudWatch Agent on an Ubuntu instance, configured collection of memory, disk, and swap, and added a dashboard with graphs. What changed? Exactly one thing: the blind spot is gone. You see not only CPU and network but also the two main instance killers: memory leaks and full disks.
In practice, this means you notice memory creeping up three days BEFORE the OOM Killer terminates PHP-FPM. You see that the disk filled up almost completely after a theme update and clear the logs BEFORE the database crashes. Without these metrics, every incident becomes a post-mortem investigation. With them, you get an alert in the channel half an hour before the outage.
If you have more than three instances, set up CloudWatch Alarms on threshold values (say, mem_used_percent > 90 for 5 minutes) and connect notifications via SNS to Slack or Telegram. Agent + alarms = you learn about the problem from AWS, not from a customer.
Agent setup is a one-time investment of 20 minutes per instance. After that, it runs on its own.

A professional team of writers and editors specializing in creating quality content.