










🗺️ MapSVG review: creating interactive maps in WordPress
Need an interactive map on your WordPress site, and standard Google Maps just won't cut it? A standard iframe map doesn't offer clickable regions, tooltips, or a filterable directory of objects. And your client wants a map with address search and color-coded regions for statistics.
MapSVG is one of the few WordPress plugins that handles all of this in one tool. It's used by 16,000+ sites, and the free version on WordPress.org lets you try nearly all the basic features without paying. Below you'll find a detailed breakdown of features, a practical setup guide, and an honest verdict on who this plugin is right for and who should look elsewhere.
💡 Quick overview:
- Load a ready-made SVG map from the built-in library or upload your own file.
- Link database objects with custom fields to regions.
- Configure tooltips and popover windows through the template editor.
- If needed, overlay the vector map on Google Maps.
- Insert the shortcode on a page and check the result.

What MapSVG can do: a breakdown of key features
The plugin is developed by Roman Stepanov (RomanCode on WordPress.org). The project has been active since 2012 and receives regular updates: as of June 2026, version 8.6.6 is current, with multiple releases per month according to the changelog. This matters for a plugin that works with the Google Maps API, since without regular updates maps break whenever the API key changes.
100+ ready-made geo-calibrated maps
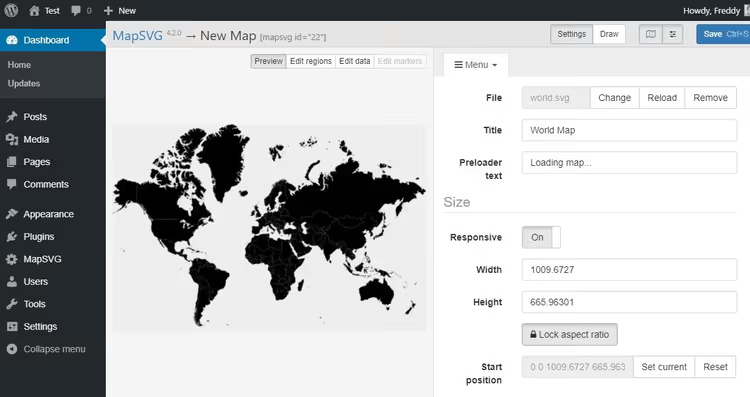
The plugin ships with a library of more than 100 geo-calibrated SVG maps. The world map is already divided into clickable countries. Country maps with divisions into states, provinces, and regions are available separately. There are also several specialty maps.
Geo-calibration means that each area of the map is tied to real coordinates. You can add markers by address or latitude/longitude, and they'll land precisely on the correct region. Can't find the right map in the library? Draw an SVG in Inkscape or Adobe Illustrator, upload it to MapSVG, and the plugin turns your vector into an interactive map with clickable zones.
Database objects with custom fields
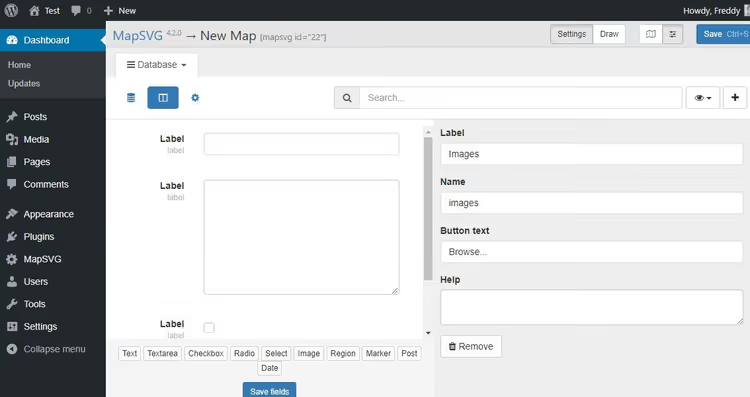
This feature sets MapSVG apart from most WordPress mapping plugins. You create entries (objects) in the plugin's built-in database with any set of fields you need: text, numbers, images, checkboxes, dropdown lists. Then you link an object to a specific map region.
Example: a real estate agency creates objects for properties with address, price, area, and photos. Each object is linked to a region on the map. A visitor clicks an area and sees the property card in a beautiful popup window, detail view, or tooltip. No external plugin needed for data storage; everything stays inside MapSVG.
Directory with filtering and search
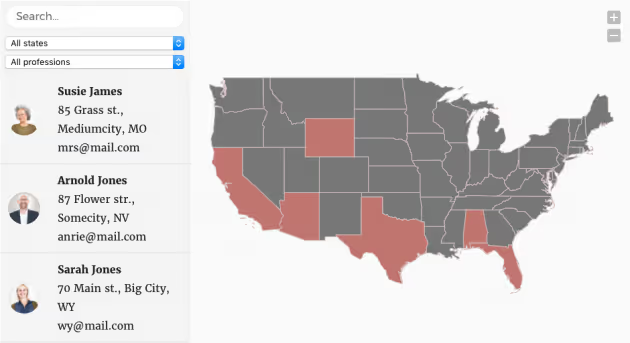
Database objects can be displayed not only on the map but also as a filterable directory beside it. When a user enters a query in the search bar or selects a value from a dropdown filter, the directory and map update in sync. Clicking a map region filters the directory, and vice versa.
Premium versions add filters by category, postal code, and date. CSV import is supported, and starting with the Plus tier, data can be pulled directly from Google Sheets (when the source updates, the map updates automatically).
Vector map overlay on Google Maps
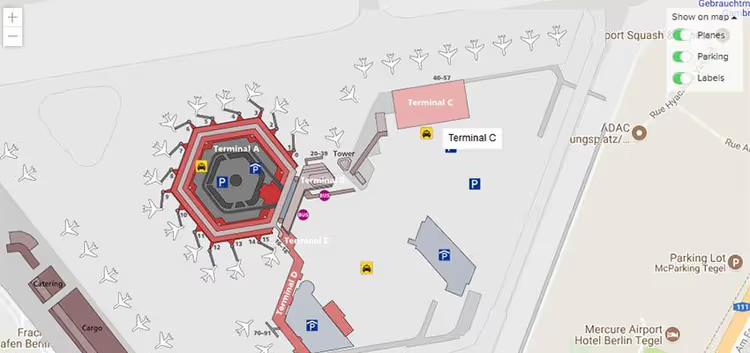
Standard Google Maps via iframe offer almost no customization. MapSVG solves this problem radically: you overlay your own interactive SVG layer on top of Google Maps of any type (satellite, terrain, roadmap, hybrid). All you need is a Google Maps API key.
The vector layer is fully clickable: zones, markers, and tooltips work just like on a regular SVG map. The result is a map that looks like Google Maps but behaves like a fully custom web application. Landmark highlighting, interactive routes, and regions are all configurable.
Built-in CSS, JavaScript, and Handlebars template editors
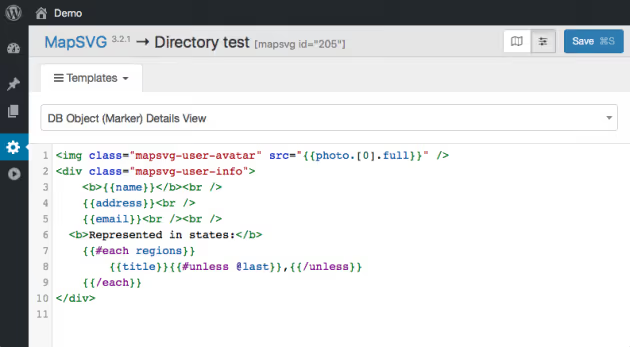
For those who work with code, MapSVG offers three built-in editors. The CSS editor lets you change tooltip styles, popup windows, and markers while seeing results in real time. The JavaScript editor lets you hook into map events (region click, hover) and write middleware logic. The Handlebars template editor gives you full control over the HTML structure of tooltips, popover windows, and detail views.
In practice this means a tooltip template with a photo, price, and "Learn more" button can be built in five minutes. And through JavaScript you can, for example, send an AJAX request on region click and dynamically load data.
Control panel with real-time preview
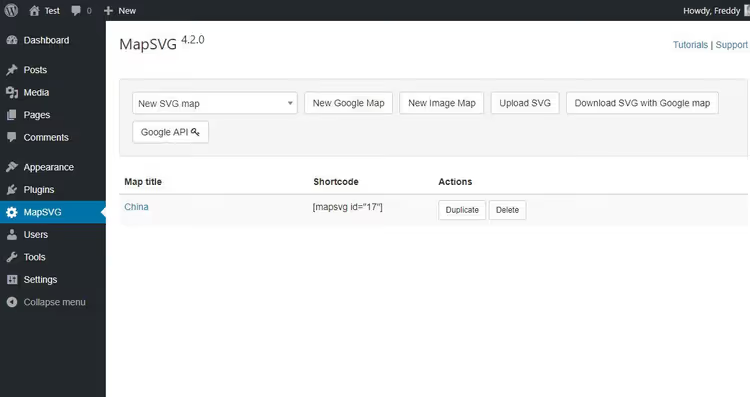
The MapSVG interface is a dedicated panel inside the WordPress admin. Map creation is a step-by-step process: choose source, configure regions, colors, tooltips, publish. All changes appear instantly in the preview window; you don't need to save and refresh the page to see results.
Navigation works through a dropdown menu organized by sections (Regions, Colors, Templates, Settings). The interface may feel overwhelming for beginners since there are many options, but after the first hour the logic becomes clear.
Maps from raster images
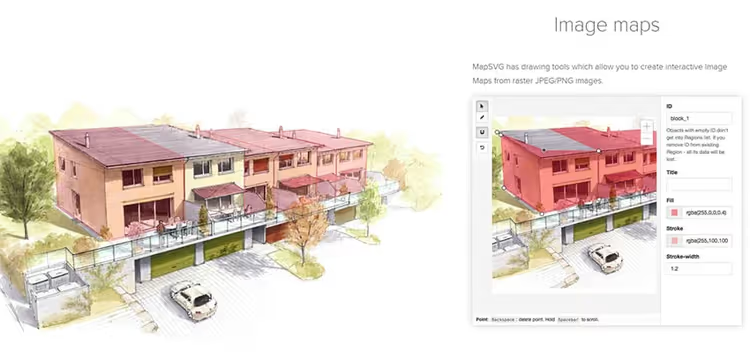
MapSVG works not only with vector SVGs but also with regular PNG and JPEG files. Built-in drawing tools let you trace areas over a raster image, and they become clickable zones. This opens up scenarios that vector maps can't handle: interactive floor plans, seating charts, blueprints, routes, and city plans.
Technically you take a photo of a building plan, trace rooms with the "Draw Region" tool, add labels, and you get an interactive plan where clicking on a room shows information about it. Clients in the event and real estate industries will appreciate this.
Practical guide: installation and creating your first map
Installing MapSVG is no different from any other WordPress plugin. The difference is in the map creation process: you need at least one pass through the menu to understand the interface logic. After that it's smooth sailing.
Step 1. Installing the plugin
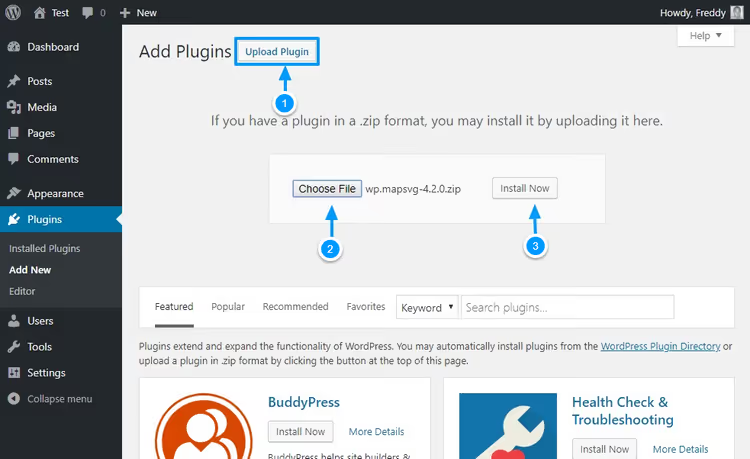
Download MapSVG from WordPress.org (free Lite version) or purchase premium at mapsvg.com. Then in the WordPress admin: Plugins → Add New → Upload Plugin.
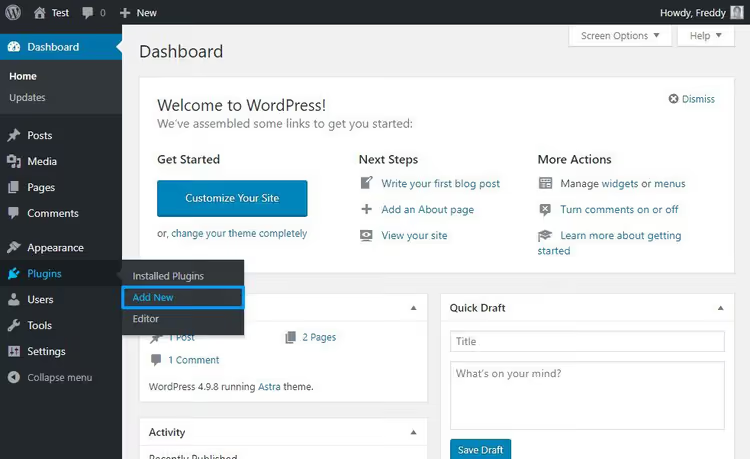
Click Upload (1), select the plugin ZIP file (2), and Install Now (3):
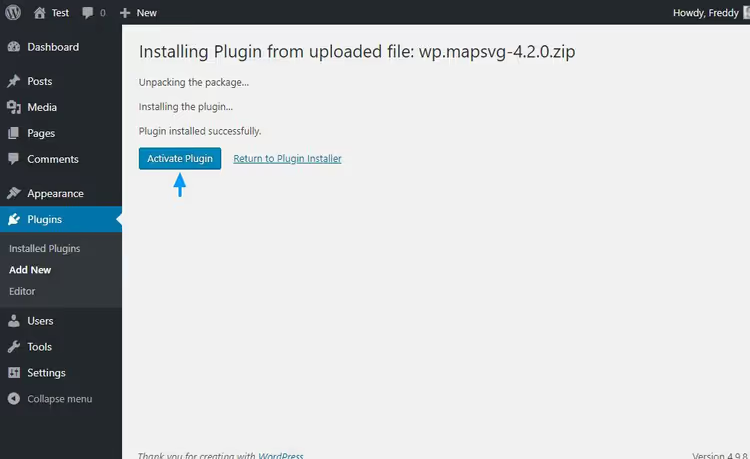
Wait for installation to complete and activate:
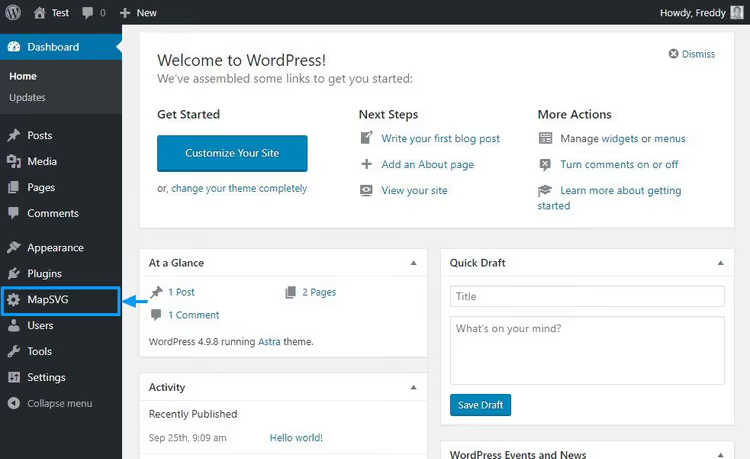
Done. A MapSVG item will appear in the admin sidebar menu; click it.
Step 2. Creating a map from a ready-made template
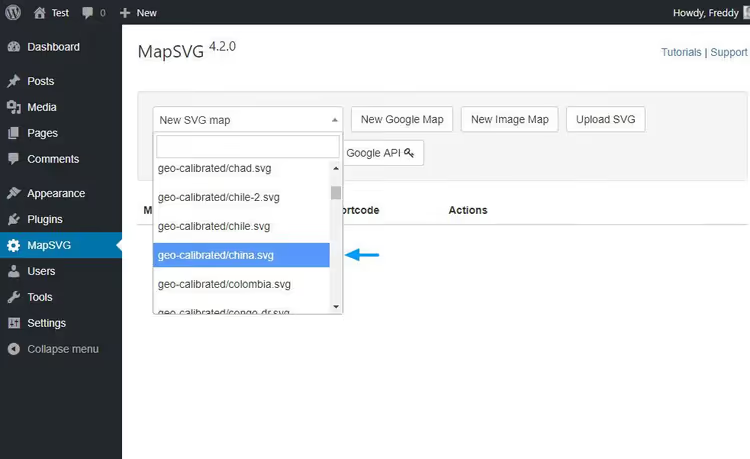
On the MapSVG panel start screen you'll see options: choose a ready-made map, create a Google map (after inserting an API key), build an image map, upload your own SVG, or upload an SVG file on top of Google Maps. The Tutorials and Support links at the top of the panel lead to documentation and support.
Choose New SVG Map and find the map you need in the dropdown list. For this example we'll use the China map, which is divided into provinces and fully ready to work with.
On the next screen fill in the map title. Here you can also configure size, responsiveness (enabled by default), tooltips, and popup windows. Regions are already clickable, and the map is ready for customization.
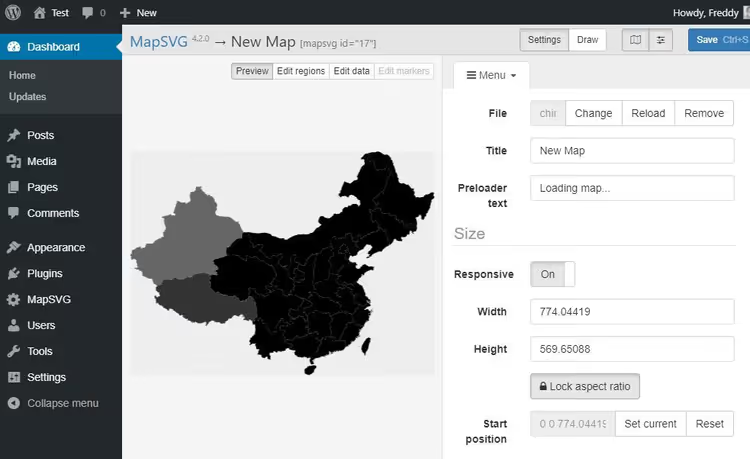
Step 3. Configuring colors
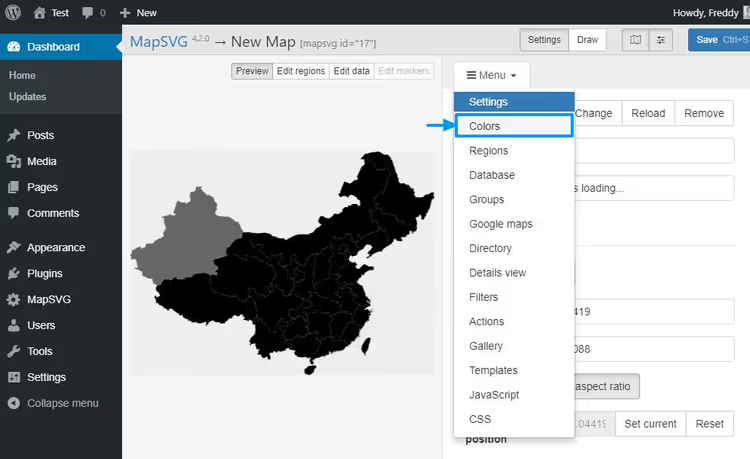
Go to Menu → Colors. The color palette lets you set colors for regions, background, stroke, and states (hover, active). There are no restrictions; choose any shades.
Once you've set the colors, click Save Ctrl + S:
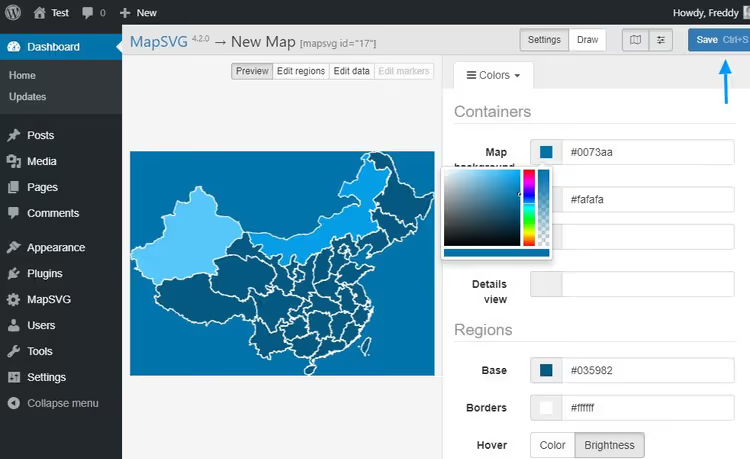
The map immediately recolors in the preview window. A few clicks and the color scheme is done.
Step 4. Adding tooltips
Create a tooltip template. Go to Menu → Templates → Region Tooltip. The Handlebars template editor supports the {{title}} tag, which outputs the region name. Basic template:
1 Region: <strong>{{title}}</strong>
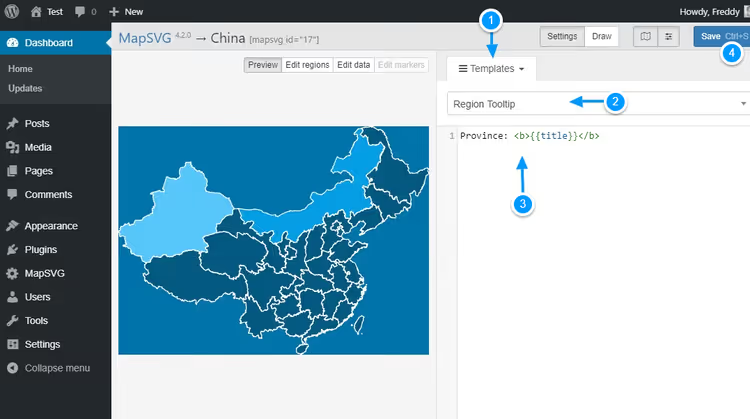
Click Save Ctrl + S. Then enable tooltips: Menu → Settings → Tooltips.
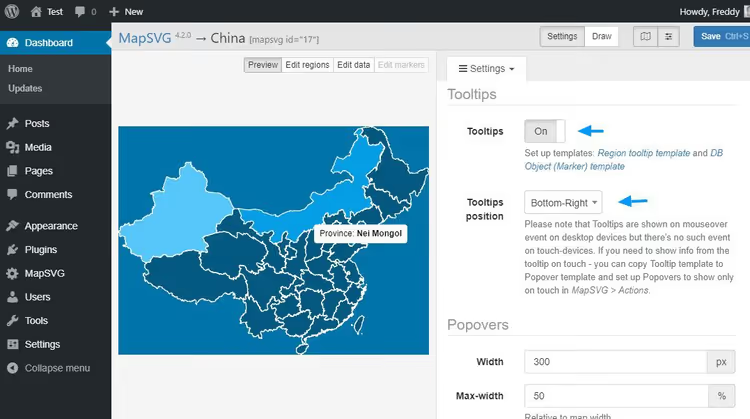
Now when you hover over a region, a tooltip with its name appears. This is the basic scenario. To add photos, prices, and other data to the tooltip, you'll need custom fields.
Step 5. Custom fields through database objects
MapSVG lets you add custom fields to regions. Field types include text, textarea, checkbox, images, and others. Let's create an image field.
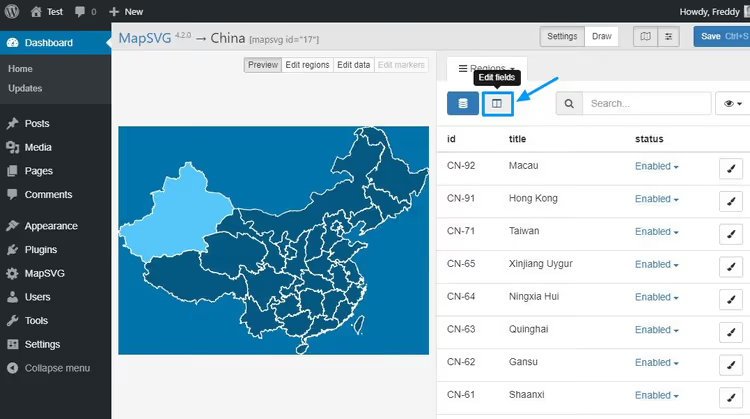
Go to Menu → Regions and click Edit fields:
Click the Image button to add an image-type field, then Save fields:
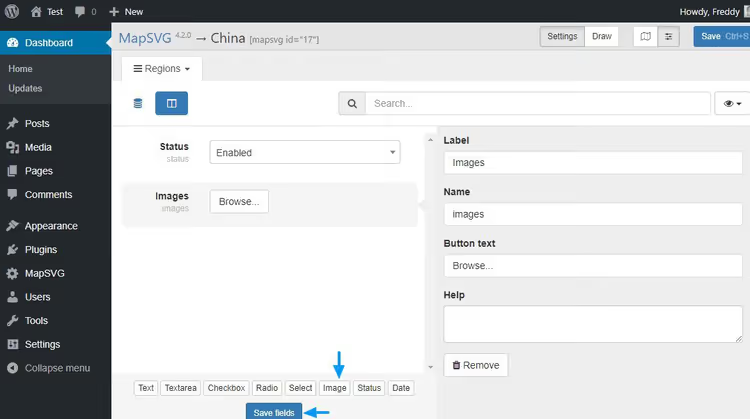
Don't forget to click Save Ctrl + S. Then switch to the List tab:
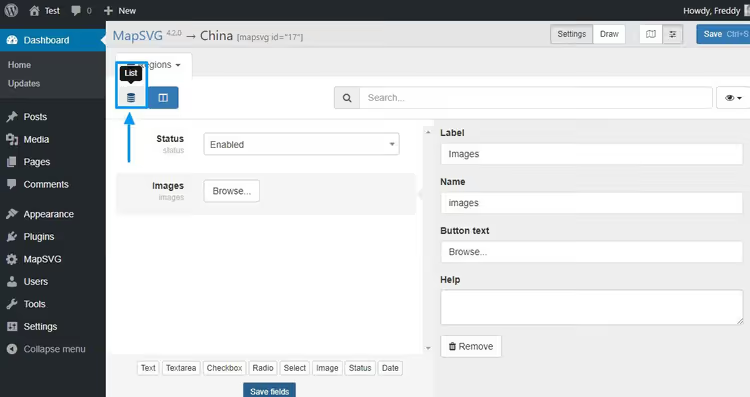
Enable Edit Regions mode and click the desired region (for example, Nei Mongol). A new Images field will appear on the right. Click Browse:
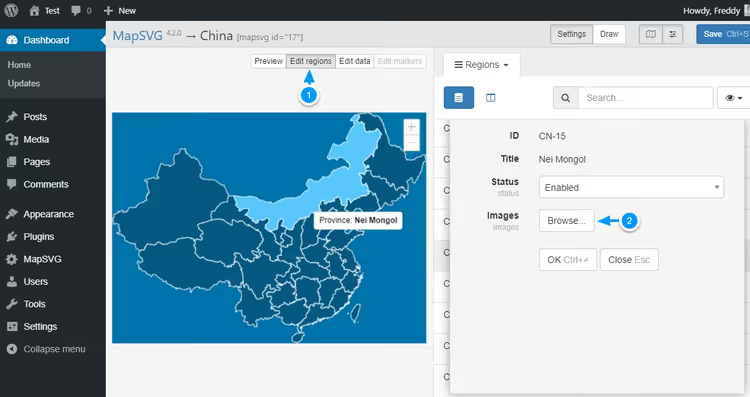
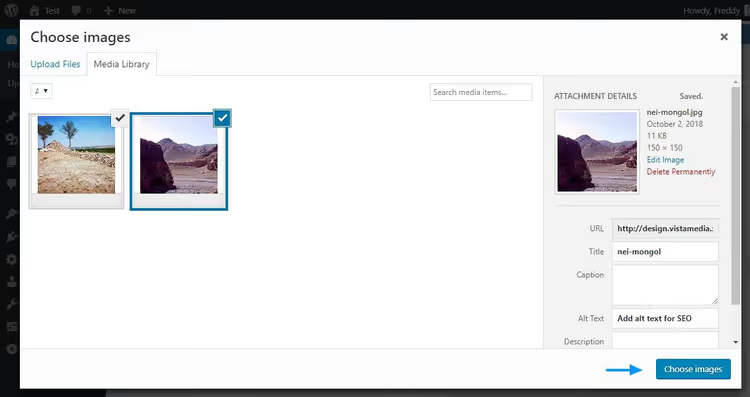
Add images through the WordPress media library and click Select images:
The system will return you to the region editing screen. Click OK (1), then Save Ctrl + S (2), and switch back to Preview mode (3):
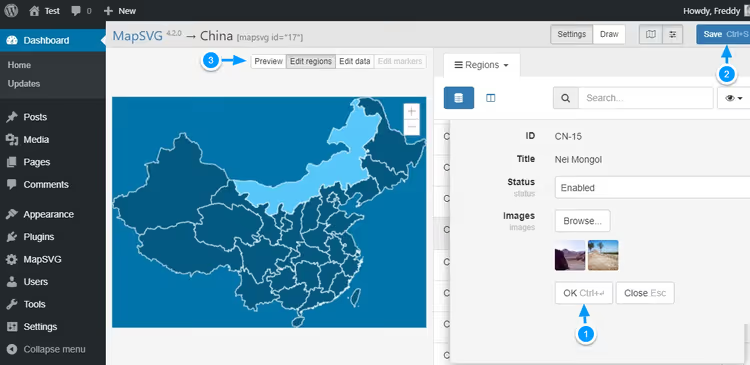
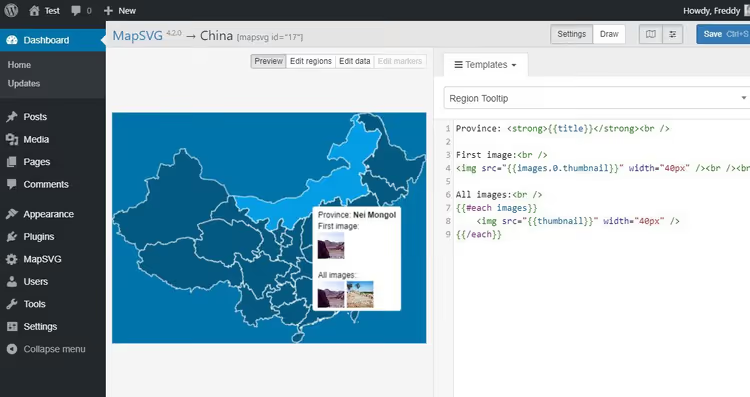
The images are added, but they won't appear in the tooltip yet; you need to update the template. Go to Menu → Templates → Region Tooltip and replace the code:
1 Region: <strong>{{title}}</strong><br /> 2 First image:<br /> 3 <img src="{{images.0.thumbnail}}" width="40px" /><br /><br /> 4 All images:<br /> 5 {{#each images}} 6 <img src="{{thumbnail}}" width="40px" /> 7 {{/each}}
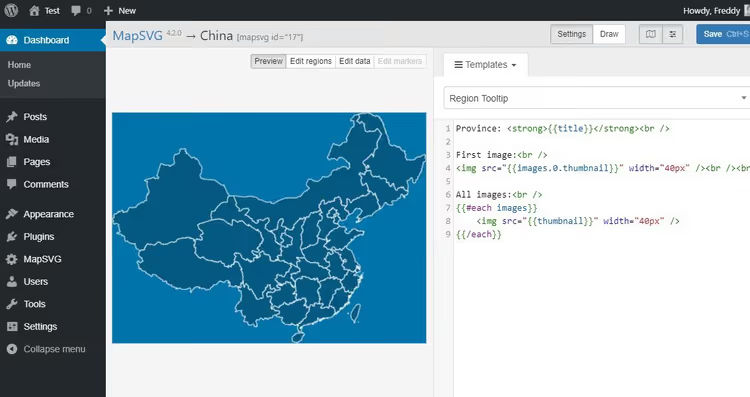
Save the template. Now when you hover over Nei Mongol, the tooltip shows the uploaded images:
Step 6. Publishing the map on your site
Save all changes. Go to Pages → Add New, click the MapSVG button above the editor:
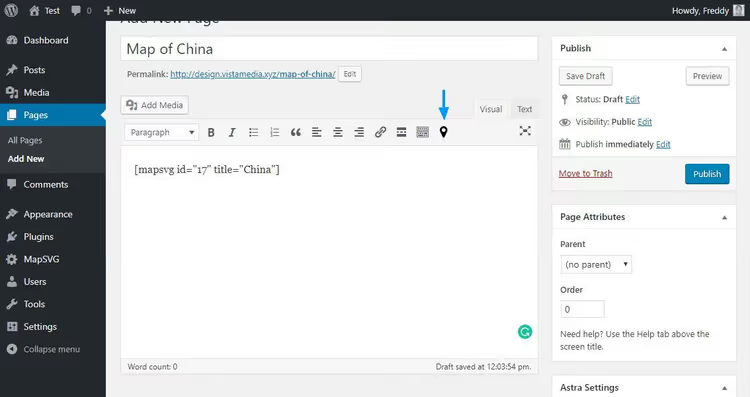
Select the created map from the list, and the plugin will insert the shortcode [mapsvg id="17" title="China"]. Publish the page and check the result on the frontend:
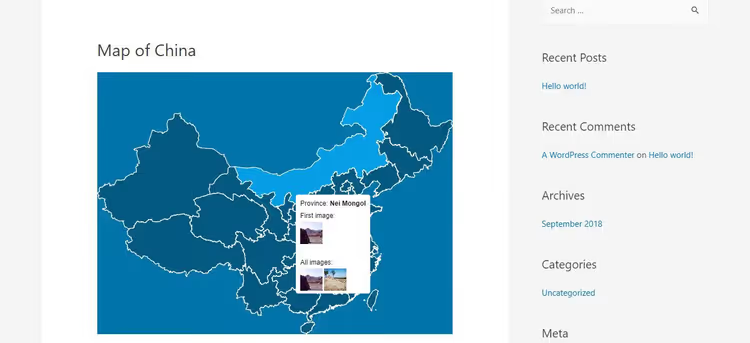
The map is fully responsive; on mobile devices regions and tooltips work without losing functionality. The shortcode can be inserted into any post, page, or widget, and the map will load correctly.
⁉️🤔 Frequently asked questions
Do I need a Google Maps API key for MapSVG to work?
Only if you plan to use the Google Maps layer. For working with ready-made SVG maps from the library and your own SVG files, no key is required. If you do need Google Maps, get an API key from the Google Cloud Console and enter it in the plugin settings; the process takes a couple of minutes.
Can I upload my own SVG file?
Yes. Draw a map in Inkscape or Adobe Illustrator, save as SVG, upload to MapSVG. The plugin will automatically turn vector shapes into clickable regions. If the map isn't geo-calibrated, markers by address won't work; you'll need to place them manually.
What's the difference between the paid and free versions?
The free Lite version gives you unlimited maps and markers, tooltips, popover windows, and custom fields. Paid tiers add features progressively: Starter ($49/year) adds a filterable directory and custom templates; Plus ($99/year) adds Google Sheets integration, ACF, and Metabox; Pro ($199/year) adds marker clustering and front-end editing; Elite ($299/year) adds REST API and MySQL data sources. Lifetime licenses are also available, ranging from $99 to $599.
Is the plugin suitable for non-coders?
A basic map with regions and tooltips can definitely be made without code; the interface is visual. But once you need custom tooltip templates (Handlebars) or styling (CSS), minimal HTML understanding will help. The documentation at mapsvg.com/docs is written with examples, and support responds quickly.
Do the maps slow down the site?
No. An SVG map is a vector that weighs kilobytes, not megabytes. Rendering happens via JavaScript on the client side. With a large number of markers (hundreds or thousands) we recommend enabling clustering, which is available from the Pro tier.
What about support and updates?
The plugin is updated several times a month; the changelog on WordPress.org shows the developer actively fixing bugs and adding features. Support is available through a built-in chat directly from the admin panel (after activation). Users note in reviews that responses are fast, but due to timezone differences an answer may take several hours.
Is MapSVG worth buying: final verdict
MapSVG is a specialized tool that stands head and shoulders above standard Google Maps plugins when you need real interactivity: clickable regions, filterable directories, and custom tooltips. If your task is "insert a directions map," the plugin is overkill. If your task is a real estate map, store locator, interactive regional statistics, or seating chart, MapSVG is one of the best options in the WordPress market.
The free Lite version covers scenarios where other plugins already charge money: unlimited maps and markers, custom fields, tooltips, and popover windows. This is rare generosity for a freemium model; you can launch a project with no budget and purchase a plan when you need filters, a directory, or Google Sheets integration.
Our experience: after one evening with the documentation, a China map with tooltips and images was ready. Yes, the interface isn't intuitive at first glance (lots of options and menus), but the learning curve is short. The built-in CSS/JS/Handlebars editors are a godsend for developers: no need to dig into theme files.
If you're looking for a WordPress map plugin and don't want to hit free version limitations in a month, start with MapSVG Lite on WordPress.org. And if you need an alternative, check out our roundup of WordPress map plugins, where we compared a dozen options for different use cases.

A professional team of writers and editors specializing in creating quality content.