














⚡ 5 tools for testing WordPress speed in 2026
Site loads in 6 seconds, but visitors leave by second three? You're losing traffic, conversions and search rankings simply because WordPress isn't optimized. No need to guess "why it's slow," just run the site through the right tools once and get a list of specific issues.
Good news: most causes of slow WordPress performance can be fixed in a couple of hours. We've gathered five proven speed testing tools and explained what to do with the results to make your site fly.
💡 Quick overview:
- Run your site through PageSpeed Insights or GTmetrix and get a report with bottlenecks.
- Fix issues across five areas: hosting, plugins, images, caching and maintenance.
- Retest and compare before/after results.
Why WordPress sites run slow
Common bottlenecks in WordPress projects barely change from version to version:
- Bloated plugins. Each adds its own scripts, styles and database queries. Three "heavy" plugins can tank speed worse than twenty lightweight ones.
- Wrong hosting. Cheap shared hosting isn't built for high-traffic WordPress with dynamic queries.
- Unoptimized images. Multi-megabyte photos uploaded "as is" eat up the lion's share of load time.
- Missing caching. Every visit generates the page from scratch, which is slow and hammers the server.
Below are tools that will show which points apply to you.
5 tools for WordPress speed testing
1. Google PageSpeed Insights
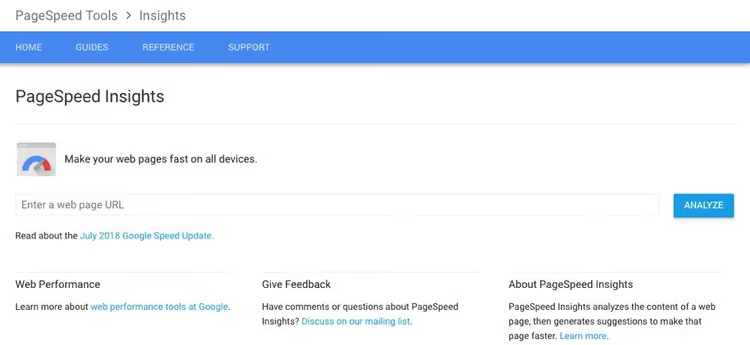
PageSpeed Insights is a Google tool that analyzes a page and provides scores for mobile and desktop. It's based on Core Web Vitals (LCP, INP, CLS), the metrics Google uses in search ranking.
The report splits into lab data (simulation on an emulated device) and field data from the Chrome User Experience Report (CrUX). This is the only free tool showing real user speed perception data, not just synthetic measurements. Each audit expands to show which files or requests cause delays.
2. Pingdom Tools

Pingdom Tools gives three key numbers per run: overall performance grade, load time and page size. Below is a request "waterfall": each file, connection time, wait and receive time. You immediately see which resource is hanging.
Useful feature: test location selection. You can run tests from North America, Europe or Asia and compare. For international audiences this is critical: a server in one part of the world can show great numbers locally and fail on other continents. Pingdom saves test history, handy for tracking trends after changes.
3. GTmetrix

GTmetrix analyzes sites on two scales: Performance (Lighthouse) and Structure (their own site architecture rating). This approach separates "objective" speed from build issues that aren't always visible in pure Lighthouse.
Unique capability: Video Playback. GTmetrix records video of page loading, and you see frame by frame when content appears and where rendering delays occur. Plus scheduled monitoring, weekly runs with alerts when metrics drop.
4. WebPageTest
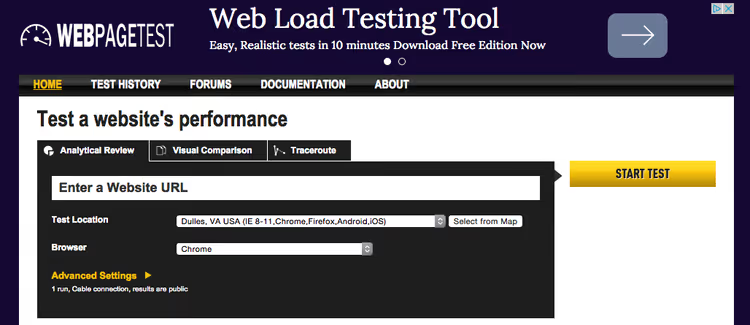
WebPageTest is an open-source tool that does three runs and takes the median, making results resistant to random network fluctuations. You can choose browser, connection type (3G, 4G, cable) and location from dozens of test points.
Detail is maximal among free tools: waterfall, filmstrip, time breakdown by domain, HTTP/2 and compression checks. For finding "floating" issues WebPageTest often gives more than any other service. Separate bonus: scripted scenarios. You can record multi-step user journeys and measure speed of each step.
5. YSlow
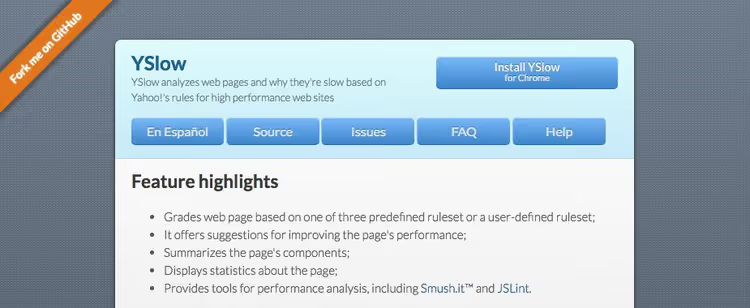
YSlow is a speed analysis veteran (2007), but still works. The browser extension analyzes the open page against 23 Yahoo! performance rules and gives grades from A to F per category.
Unlike server tests, YSlow looks at the page "through browser eyes." It doesn't give load seconds, but shows structural problems: excessive HTTP requests, missing gzip, unconfigured expires. Great for quick competitor audits. Some rules are outdated with HTTP/2's arrival, so use YSlow as an additional "second opinion," not your main tool.
What to do after testing: speeding up WordPress
Test results in hand, now let's fix what they showed. Here are five areas that cover most typical WordPress speed issues.
Hosting that doesn't slow you down

The cheapest hosting is almost never fast. Shared plans at a few dollars per month run on strict CPU and RAM limits, your WordPress stands in server queue alongside hundreds of other sites.
Specialized WordPress solutions where speed matters:
- WP Engine, the largest managed WordPress host with built-in EverCache caching, free CDN and staging environment.
- Kinsta, hosting on Google Cloud Platform with per-second billing, useful for traffic spikes.
- Flywheel, aimed at designers and agencies: demo sites for clients and simple interface without cPanel.
- Cloudways, a platform where you pick the cloud provider (DigitalOcean, AWS, Google Cloud) and manage the server through their panel.
Shared hosting also works if chosen wisely. Look not at price but at reviews about speed under load and presence of server-side caching.
Plugins: fewer means faster

The WordPress repository has over 60,000 plugins, and the temptation to add "just one more" is strong. But each plugin is code that executes on load. A poorly written plugin can generate dozens of unnecessary database queries or load its scripts on every page.
Three selection rules:
- High rating and large number of active installs. Not a guarantee, but a good filter.
- Last update within a few months. Abandoned plugins risk incompatibility.
- Compatibility with current WordPress version (check "Tested up to" on the plugin page).
To find the slowdown culprit, install Query Monitor, a free plugin showing all database queries broken down by component, hook times, PHP errors and redirects. Disable suspicious plugins one by one and remeasure speed, the "heavy" plugin reveals itself within minutes.
Image compression and optimization

Images are usually the "heaviest" page resource. A phone photo can weigh several megabytes, but after compression to WebP or AVIF, around 150-200 kilobytes at the same visual quality.
Plugins for automatic compression on upload:
- ShortPixel Image Optimizer, lossy and lossless compression, on-the-fly WebP/AVIF conversion.
- EWWW Image Optimizer, free local compression on your own server.
- Smush, bulk media library optimization in one click and lazy loading.
Without plugins: TinyPNG (PNG and JPEG) and Squoosh from Google (WebP, AVIF, before/after comparison).
Caching: so you don't rebuild pages each time

WordPress is a dynamic CMS: on each visit PHP assembles the page from database, theme and plugins. Caching replaces this process with one-time assembly and serving ready HTML, pages load many times faster and the server handles more visitors.
Two popular free plugins:
- WP Super Cache, from Automattic, simple setup: turn it on and get static HTML.
- W3 Total Cache, more controls: page, database, object caching, browser caching, minification.
WP Super Cache is the "set and forget" choice, W3 Total Cache for fine tuning. Results in numbers are similar when either is configured properly.
Regular maintenance
Speed isn't a one-time thing. Without maintenance metrics drift: spam accumulates, broken links appear, database bloats.
Minimal set of regular tasks:
- Database cleanup. Plugin WP-Optimize removes revisions, spam, transients and optimizes tables.
- Broken link monitoring. Plugins like Broken Link Checker find 404s on your site.
- Remove unused plugins and themes. Extra files in
/wp-content/are a risk and bloat backups.
The habit of running your site through a tool from the first section once a month and cleaning the database saves hours of figuring out "why is the site slow again" six months later.
⁉️🤔 Common questions
Why does PageSpeed Insights show different results for desktop and mobile?
The mobile test emulates a smartphone on 4G with CPU throttling, 4x slower than desktop CPU. A 20-40 point gap between mobile and desktop scores is normal. Work primarily on the mobile score: over 60% of traffic today comes from phones, and Google uses the mobile version for ranking (mobile-first index).
How many plugins is "too many"?
Quality matters more than quantity. Thirty well-written plugins from trusted developers can load the site less than three heavy ones with bad code. Go by tests: if disabling a specific plugin gives noticeable speed gains, find an alternative or configure selective loading.
Does site speed directly affect Google rankings?
Google counts Core Web Vitals as a ranking factor since 2021. Speed is a tie-breaker: all else equal, a faster site outranks a slower one. Direct impact is noticeable in highly competitive niches. Indirect impact is often stronger: slow site → high bounce → low time on site → behavioral signals worsen → rankings drop.
What can replace YSlow in 2026?
YSlow works but its rules are partly outdated (CSS sprites, domain sharding lost meaning with HTTP/2). Modern alternatives: DebugBear, paid, with detailed Core Web Vitals and CrUX reports; among free ones, Lighthouse in Chrome DevTools (Lighthouse tab → "Generate report"). Lighthouse gives practically the same analysis as PageSpeed Insights, but without sending data to Google's server.
Which speed testing tool to choose for your task
PageSpeed Insights is the benchmark Google assessment with field data, your main tool. GTmetrix adds load video and monitoring. Pingdom is convenient for measuring from different locations. WebPageTest is for those who need maximum depth and reproducibility. YSlow is a lightweight second opinion when auditing competitors.
Basic set covering virtually any need: PageSpeed Insights + GTmetrix. Run both, get two reports from different angles, fix the indicated problems, remeasure. The first PageSpeed Insights run takes 15 seconds, don't put it off.

A professional team of writers and editors specializing in creating quality content.