













 AIIllustrative image: AI-generated
📊 7 chart and infographic plugins for WordPress 2026 (free and Pro)
Numbers without a picture get scrolled past in a second. The same statistics as a colored bar chart make you look closer and remember. The difference is a plugin that turns dry data into a graph.
The standard WordPress editor doesn't build charts. You need a separate tool. And here's where the pain begins: some visualizers load the site like an elephant, others require Elementor, still others are abandoned and quietly break after each core update.
We tested 7 current WordPress plugins for charts, tables and infographics, from lightweight free options to Pro solutions with AI generation. All work in 2026, all were updated in recent months, and none turn the admin panel into a quest called "find the incompatibility."
💡 Quick overview:
- Want AI charts by text description, get Visualizer, there are no competitors in terms of simplicity.
- Need tables with filtering, sorting and import from Excel/Google Sheets, wpDataTables, the standard for big data.
- Looking for a completely free tool with no page builder dependency, Easy Charts for simplicity or Ninja Charts for 12+ types.
- Working with Elementor and need dynamic charts from API/Google Sheets, Graphina with 15+ types and auto-update.
- Want an infographic builder with ready-made templates, iList with 80+ layouts.
- Need tables with formulas, HTML and WooCommerce integration, Data Tables Generator from Supsystic.
Plugin | Chart types | Free version | Pro price | AI generation | Data import |
|---|---|---|---|---|---|
Visualizer | 15+ (Pro) | Yes | $99/year | Yes (D3.js) | CSV, Excel, Google Sheets |
wpDataTables | 6+ | Yes | $68.76/year | No | Excel, CSV, Google Sheets, SQL |
Easy Charts | 5 | Yes | Free | No | Manual input |
Data Tables Generator | 10+ | Yes | $59 | No | CSV, Excel, PDF, Google Sheets |
iList | 14 templates | Yes | $24 | No | Manual input |
Ninja Charts | 12+ | Yes | Free | No | Ninja Tables, Fluent Forms, manual |
Graphina | 15+ (Pro) | Yes | From $49 | No | CSV, Google Sheets, API, SQL, Firebase |
1. Visualizer, AI charts by text description

Visualizer from ThemeIsle, the most popular chart plugin for WordPress: 20,000+ active installations and 225+ reviews with an average rating of 4.4. In 2026, it's no longer just a "chart builder," but a full-fledged AI tool: you describe a chart in plain text ("bar chart of sales by month"), and Visualizer generates it in seconds. No API key, no configuration, works right out of the box.
Under the hood, Google Visualization API, DataTables.net and ChartJS. The free version gives four basic types: tables, pie, line and bar charts. The Pro version ($99/year) adds Area, Geo, Bubble, Scatter, Gauge, Candlestick, Timeline, Combo, Polar and Radar, a total of 15+ types. Candlestick chart is only available here, there are no free alternatives in the WordPress ecosystem.
Pros:
- AI chart generator without API key and hidden fees;
- responsive HTML5/SVG charts on all devices;
- import from CSV, Excel, Google Sheets with auto-sync (Pro);
- tables with sorting, pagination and search (Pro).
Cons:
- advanced chart types only in Pro;
- Pro price is above market average.
Price: free (Lite) / $99/year (Pro, 30-day refund).
🔗 Visualizer on WordPress.org🔗 Visualizer Pro
2. wpDataTables, the standard for working with large tables

wpDataTables grew out of a specific need: upload an Excel file to a site and display it beautifully. Today it's v6.5 with support for MySQL queries, Google Sheets as a data source and six chart types based on Chart.js. Active installations, 80,000+, and deservedly so: the plugin builds editable tables with formulas, conditional formatting and cell highlighting.
The main advantage is working with really large amounts of data. Tables with 10,000+ rows don't hang the site, because wpDataTables uses server-side processing. The free Lite version is functionally limited, no user table editing and SQL sources, but for basic visualization it's enough.
Pros:
- server-side processing of large tables without lag;
- import from Excel, CSV, Google Sheets, SQL;
- conditional formatting, formulas, HTML in cells;
- frontend table editing (Pro).
Cons:
- Lite version is heavily limited;
- interface may seem overloaded to a beginner.
Price: free (Lite) / $68.76/year (Pro).
🔗 wpDataTables on WordPress.org🔗 wpDataTables Pro
3. Easy Charts, minimalist and completely free
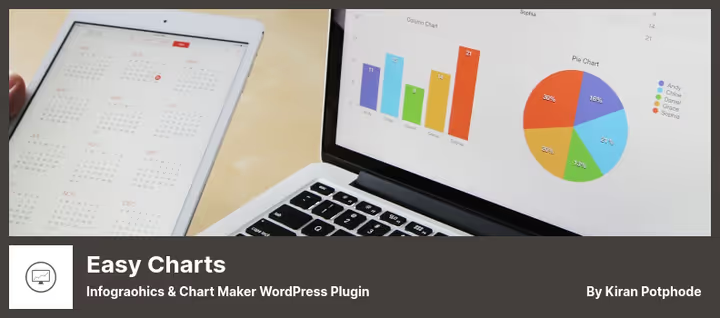
Easy Charts lives up to its name: it's the simplest way to add a chart to a WordPress site. Five types, bar, line, pie, percentage bar and percentage line. Manual data input, instant preview, and that's it, nothing more. The plugin is completely free, with lifetime support.
The ideal choice when you need "one chart in one post" without half an hour of studying the interface. Drawbacks: only manual data input, no import from CSV/Excel. Five chart types, that's the ceiling. Last update, August 2025, the plugin is alive, but developing slowly.
Pros:
- extremely simple interface, suitable for beginners;
- completely free, no hidden Pro tiers;
- chart preview before publishing;
- download chart as an image.
Cons:
- only manual input, no import from CSV/Excel;
- only 5 chart types;
- infrequent updates.
Price: free.
🔗 Easy Charts on WordPress.org
4. Data Tables Generator, tables with formulas and WooCommerce
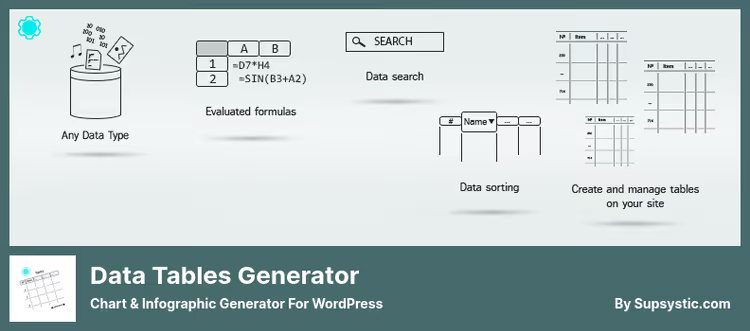
Data Tables Generator from Supsystic, a combine harvester for those who need not just charts, but interactive tables with advanced features. The plugin supports import from CSV, Excel, PDF and Google Sheets, can work with formulas and HTML inside cells, and through the Pro version opens Google Charts for building graphs directly from tables.
An interesting feature is WooCommerce integration: you can display products in table format with filtering and search. For catalogs and price lists, that's the thing. The plugin is translated into 10+ languages, a plus for multilingual projects.
Pros:
- WooCommerce integration;
- support for formulas and HTML in cells;
- import from PDF (rare feature);
- frontend table editing.
Cons:
- charts via Google Charts only in Pro;
- admin interface looks outdated.
Price: free (Lite) / $59 (Pro).
🔗 Data Tables Generator on WordPress.org🔗 Data Tables Generator Pro
5. iList, infographic builder, not just charts
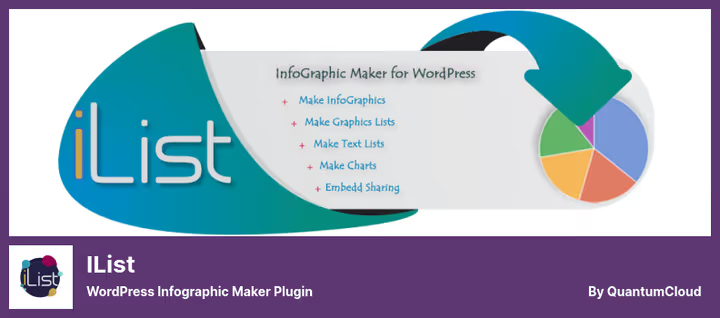
iList stands apart: it's not a chart builder, but a full-fledged infographic constructor. 80+ built-in templates, 14 ready-made layouts, you assemble the visual from text and graphic blocks, customize colors and fonts, and the plugin generates a responsive HTML block. You embed the finished infographic with a shortcode anywhere.
A feature for content projects: iList can create multi-page listicles with unique URLs and ad placements for monetization. Compatible with Gutenberg and Elementor. Pro version for iList Pro for $24, one of the most affordable on this list.
Pros:
- 80+ templates, a constructor, not just charts;
- multi-page listicles with ad blocks;
- infographic embedding on other sites;
- compatibility with Gutenberg and Elementor.
Cons:
- not designed for building charts from tabular data;
- fewer active installations than leaders.
Price: free (Lite) / $24 (Pro).
6. Ninja Charts, 12+ chart types, completely free

Ninja Charts from the WPManageNinja team, one of the fastest-growing free plugins for WordPress charts. Updated in May 2026 (v3.4.1), has a built-in Gutenberg block and 12+ chart types: line, pie, bar, bubble, radar, polar, scatter, funnel and combo.
Strong point, deep integration with Ninja Tables and Fluent Forms: data from tables and forms is automatically pulled into charts. The plugin is completely free and, unlike many "freemium" competitors, doesn't cut key features.
Pros:
- completely free, no Pro tier;
- 12+ chart types;
- Gutenberg block (v3.4.0+);
- integration with Ninja Tables and Fluent Forms.
Cons:
- no AI generation;
- no direct import from CSV/Google Sheets (only through Ninja Tables);
- smaller community than Visualizer.
Price: free.
🔗 Ninja Charts on WordPress.org
7. Graphina, dynamic charts for Elementor

Graphina from Iqonic Design, an Elementor addon with 15+ chart types based on Apex Charts, Google Charts and D3.js. The free version gives a full set of static charts with more than 1,000 variations: colors, gradients, shadows, axis labels and legends, all through the visual Elementor interface, without code.
The Pro version turns Graphina into a business intelligence tool: dynamic charts from Google Sheets, CSV, REST API, SQL queries and Firebase with AJAX auto-update. There's role access, password protection and export to PNG/SVG/CSV. 60-day money-back guarantee.
⚠️ Important: the plugin requires installed Elementor, the free version is enough. If you don't use Elementor, check out Visualizer or Ninja Charts.
Pros:
- 15+ types based on Apex Charts and Google Charts;
- visual configuration through Elementor, without code;
- dynamic data from API, SQL, Google Sheets (Pro);
- AJAX auto-update of charts (Pro).
Cons:
- requires Elementor, doesn't work without it;
- mixed reviews on update stability.
Price: free (Lite) / from $49 (Pro, 60-day refund).
Video overview: animations and visual tricks when building charts in WordPress.
⁉️🤔 Frequently asked questions
What's the difference between a chart visualizer and an infographic builder?
A chart is "number + graph": linear sales growth, pie budget breakdown, bar comparison. Infographic is a composition of text, icons and graphic elements, where a chart can be one of the parts. Visualizer and wpDataTables build charts; iList assembles infographics from templates.
Can you get by without a plugin, for example, through Google Charts embed?
Technically yes: Google Charts gives code for insertion via
<iframe>or JavaScript. But without a plugin you lose responsiveness (native Google Charts don't always scale correctly), caching (each iframe is an extra HTTP request) and editing convenience. You'll have to change data in code, not in admin. A plugin gives a visual interface on top of the same Google Charts API, it's a time saver on every update.
What to do if the plugin conflicts with a theme or another plugin?
Chart plugins rarely conflict with themes: they use isolated libraries like Chart.js, Apex Charts and Google Charts. More often the problem is in another active plugin. Procedure: disable everything except the visualizer, check, enable one by one to find the conflict. Visualizer and wpDataTables are tested for compatibility with most popular themes.
Is Elementor needed for working with chart plugins?
From this list, only Graphina requires Elementor. The other six work with any page builder, Gutenberg, Classic Editor, Divi, Brizy. A chart is inserted with a shortcode or block.
Which plugin is better for SEO if search engines don't "read" graphics?
All plugins from the list render charts in HTML5/SVG or through canvas with accessible text alternatives. Table data is indexed directly. For charts, the main thing is to fill in alt texts and surround the chart with a text explanation: what's shown, what conclusions. A search engine ranks a page by the text around the visual, not by the graphic itself.
Can you build stock candlestick charts in WordPress?
Yes, Visualizer Pro supports Candlestick Chart, the very type for displaying opening, closing, high and low prices. There are no free alternatives for candlestick charts in the WordPress ecosystem.
What to install in 2026
For a personal blog with a couple of charts a year, you don't need a Pro version: Easy Charts, Ninja Charts or free Visualizer will cover the task with a margin. For a content project where data is updated regularly, wpDataTables Pro pays for itself on the first table with auto-sync, manually updating 50+ rows every month eats hours that automation reduces to zero.
Working with Elementor, get Graphina. For $49 a year you get dynamic dashboards from API and Google Sheets that otherwise you'd have to assemble through Zapier and embed hacks.
The main criterion is the speed of creation "from scratch": Visualizer with AI generator is out of competition. Text description turns into a ready-made chart in seconds, without a single manual setting. In 2026, this is no longer a trick, but a working tool.
Choose for your specific task, not for "best by rating." There's no ideal plugin for all scenarios. And yes: before installing any plugin, make a backup, just in case.

A professional team of writers and editors specializing in creating quality content.